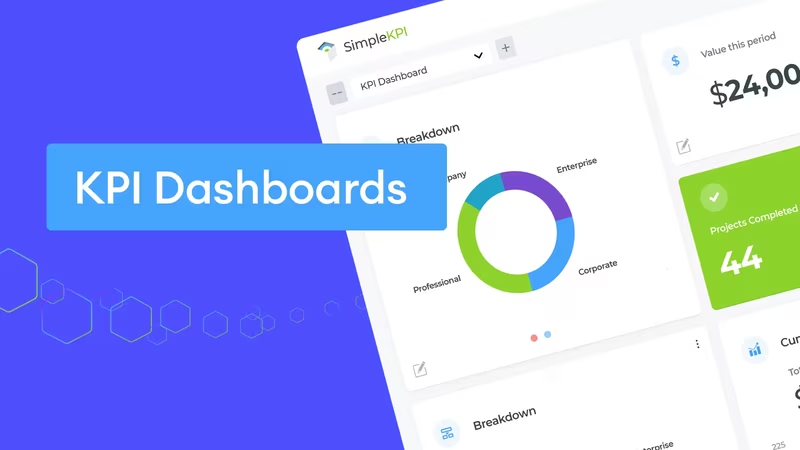
KPI Dashboards: A Comprehensive Guide
Master the art of creating and using KPI dashboards to drive business success.
Read More
KPI Software Guide and Review 2026
The right KPI software can help improve performance and provide growth.
Read More
KPI Reports explained
A complete guide to crafting compelling KPI Reports with practical examples.
Read More
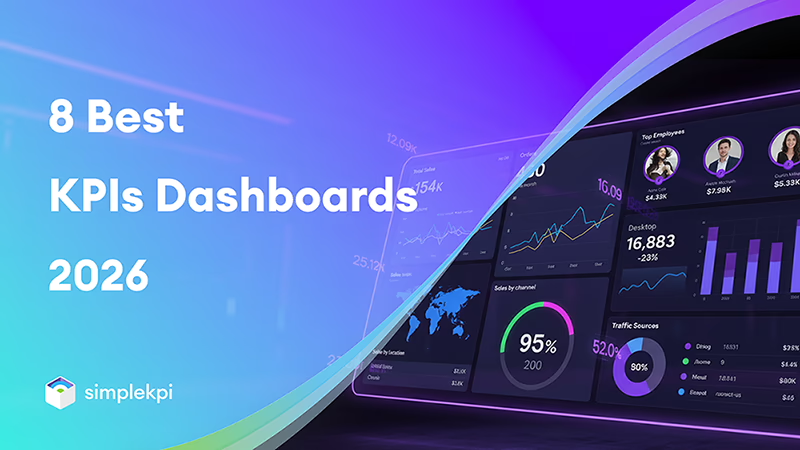
Best KPI Dashboards for 2026
Real-Time KPI Dashboards That Actually Help You Decide Faster
Read More
5 Hidden SimpleKPI Gems Uncovered
Make your dashboards & Reports smarter with these hidden features.
Read More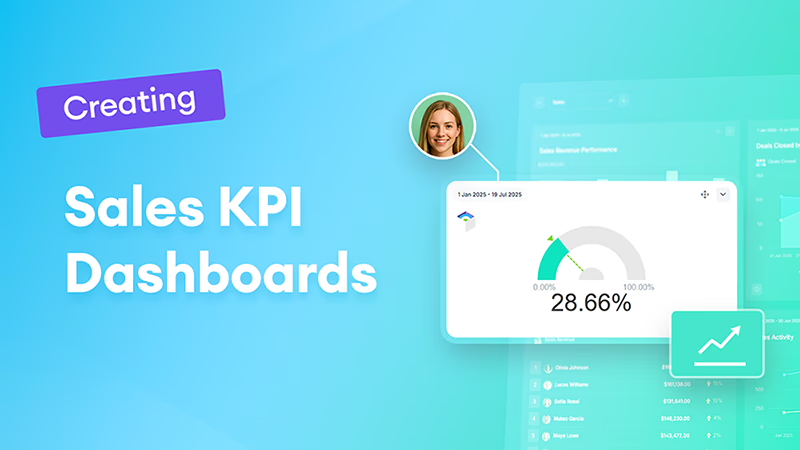
Creating a Sales KPI Dashboard in SimpleKPI
Your Step-by-Step Guide to Smarter Sales Tracking
Read More
Benford's Law: Transform the Way You Look at KPIs
Discover the mathematical marvel that can enhance your KPI tracking and business decisions.
Read More
Qualitative KPIs to the Rescue
Balancing data-driven insights with human-centric metrics.
Read More
The Art of Customizing KPI Dashboards
How to create storytelling dashboards tailored to your team.
Read More
How to Build a KPI Culture in Your Organization
Discover the steps to create and implement a KPI Culture that works.
Read More
SMART & SMARTER KPIs Explained
Go beyond basic metrics. Learn how to define, implement, and evaluate truly effective KPIs for your business dashboards.
Read More
8 KPIs Needed to Get to Mars, Sort Of
Choosing the Mission-Critical Metrics for Your Biggest Goals.
Read More
Understanding KPI Dashboard Types
Dashboards by Purpose: Strategic, Operational, and Financial Insights
Read More
21 Production KPIs you should be tracking
Monitor These Metrics to Optimize Production Efficiency, Quality, and Profitability
Read More
KPI Dashboards Fueling Creator Growth
Harnessing data to Thrive in the Creator Economy.
Read More
5 Examples of KPI Bad Practices You Need to Avoid
Dodge these five frequent tracking blunders for clearer insights
Read More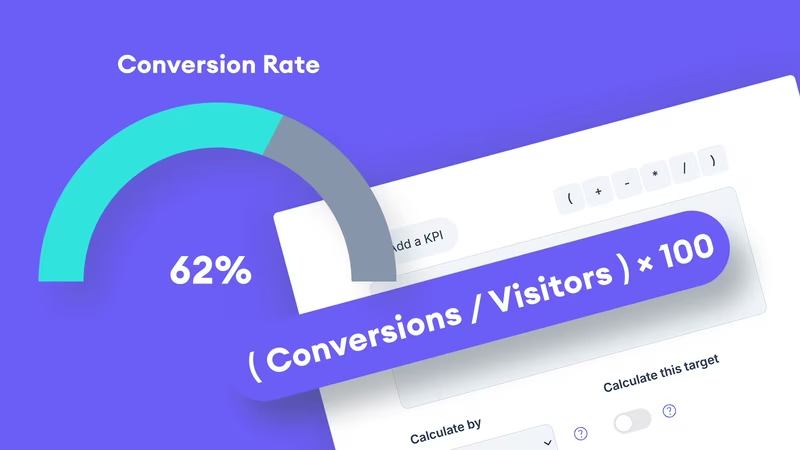
How to Create Powerful KPIs Using Formulas
A Simple Guide to Calculated KPIs.
Read More
KPIs for Remote Work: Measuring What Matters
Tracking Performance Without Micromanaging.
Read More

Essential KPIs for a Strong Year-End Performance
How to finish Q4 strong and prepare for next year.
Read More
KPIs: When Less is Really More
Discover why simplifying your KPI strategy can lead to greater success.
Read More
How KPI Dashboards Are Solving Real-World Problems
Discover innovative uses of KPI dashboards in non-corporate sectors.
Read More
12 Essential Art Gallery KPIs
Driving Art Gallery Excellence: The Role of KPIs in Modern Management.
Read MoreHow AI and Machine Learning Are Transforming KPI Tracking
Discover the cutting-edge techniques and benefits of AI-powered KPI tracking.
Read More
5 Performance Management Myths Debunked
Avoid these simple performance management pitfalls.
Read More
From Chuckles to Charts: The Power of Fun KPIs in the Office
How humor and creativity can revolutionize KPI tracking and workplace culture.
Read More
KPIs to navigate modern supply chain challenges
Tackling sustainability, transparency, environmental issues, and fair trade.
Read More
Introducing Our New KPI Generator
Leverage AI to generate KPIs tailored to your industry and goals.
Read More
Coffee Shop KPIs
Stay Ahead with Real-Time, Predictive, and AI-Driven KPI Dashboard Innovations
Read More
Supercharge Your KPIs with Benchmarking
How to use industry benchmarks to set smarter goals.
Read More
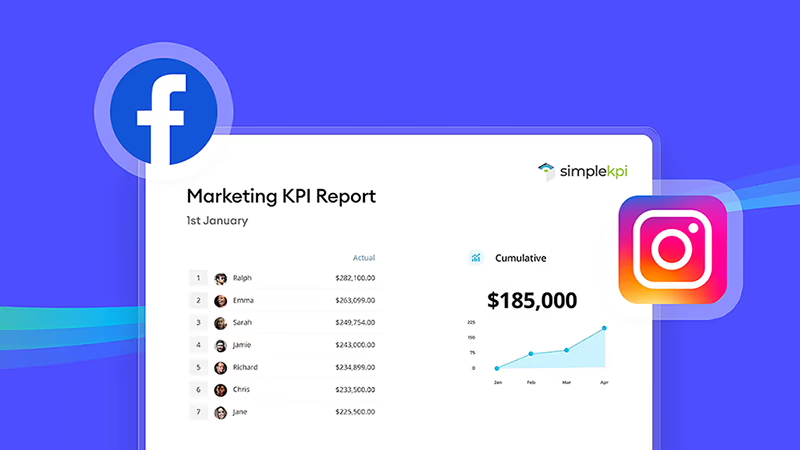
28 Marketing KPI Must Haves
In the ever-evolving marketing landscape, a brand's compass guiding it toward success is its set of Key Performance Indicators (KPIs).
Read More
Netflix vs. Blockbuster: How a KPI Dashboard Could Have Changed Everything
Discover the role of KPIs in shaping business strategies and avoiding critical missteps.
Read More
Introducing the New SimpleKPI Help Center
Explore our expanded support system with more resources, videos, and an AI chatbot.
Read More
A Quick Guide to OKR Dashboards
Learn how to leverage OKR dashboards to align goals and track progress effectively.
Read More
Navigating Economic Uncertainty with KPIs
How to use KPIs to stay ahead in uncertain times.
Read More
The Ultimate Guide to Employee KPIs
How to create, track and communicate a performance inititive.
Read More
How to Optimize Your Media and Telecoms KPIs in 2024
Discover strategies to enhance performance tracking in the media and telecom industry.
Read More
8 Non-Profit KPIs You Should Be Tracking and Why
Discover the KPIs needed to meet the challenges faced by non-profit organizations.
Read More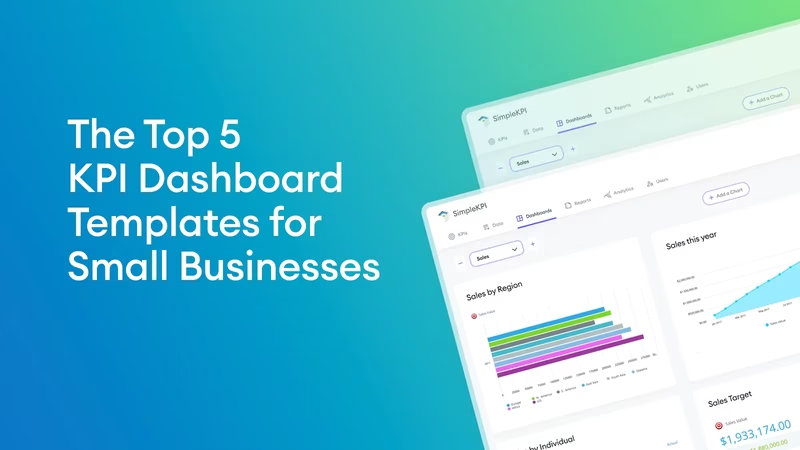
The Top 5 Dashboard Templates for Small Businesses
Discover the essential small business dashboard templates for growth.
Read More
Growing brand awareness using social media KPIs
Track, manage and grow your social media presence with SimpleKPI
Read More
Essential KPIs for Sales
It's universally accepted that most sales department KPIs are vital for success.
Read More
Monitor These Metrics to Enhance Repair Center Efficiency and Customer Service
Key Performance Indicators Every Repair Center Should Track for Success
Read More
7 Automotive KPIs that really matter
Key Metrics to Track for Automotive Industry Success and Market Advantage
Read More
8 Boutique Hotel KPIs essential for growth
Track These Metrics to Drive Boutique Hotel Profitability and Guest Satisfaction
Read More
KPI Scorecards Explained
Understand How KPI Scorecards Measure and Improve Business Performance
Read More
How Golf Clubs use KPIs to maintain their growth
Discover the Metrics Driving Golf Club Performance and Member Satisfaction
Read More
6 KPI Dashboard Trends for 2022 and beyond
Key Trends Shaping KPI Dashboards in 2022 and Beyond
Read More
KPI Analytics, a complete guide
Unlock Actionable Insights by Measuring, Analyzing, and Acting on Performance Data
Read More
Happy KPI Analytics, learning to love your data
Transform Data Into Delightful Insights for Smarter Business Decisions
Read More
Implementing KPI Software
Steps to Successfully Deploy and Maximize Your KPI Software Solution
Read More
What are Metrics and Measures
A Practical Guide to Their Key Differences and Effective Use
Read More
KPI Software Trends for 2021
Emerging Innovations Shaping KPI Software in 2021 and Beyond
Read More
Zapier and SimpleKPI, a perfect combination
Get more from your data integrations with SimpleKPI
Read More
Introducing new pivot table reports
Explore Enhanced Data Analysis with Powerful New Pivot Table Features
Read More
We need to talk about KPI spreadsheets
The Hidden Risks of Relying on Spreadsheets for KPI Tracking
Read More
The effective use of graphs and charts on dashboards
Maximize Clarity and Insight with Well-Chosen, Simple Visualizations
Read More
The 5 Essential KPIs Challenge
Cut Through the Noise: Finding the Five KPIs That Truly Matter
Read More8 Inspirational KPI Dashboards for performance tracking
See How Top Dashboards Visualize KPIs Across Diverse Industries and Goals
Read More
Using KPIs for E-Business Success
Track These Essential Metrics to Drive E-Business Growth and Customer Loyalty
Read More
Taming KPI Chaos
Regaining Control: Simplifying Your KPI Dashboard for Real Insights
Read More
GDPR a Welcome Revolution
How GDPR Empowers Businesses to Build Trust and Protect Data
Read More
KPIs: The Key to Continuous Business Improvement
Measure What Matters: KPIs as Drivers of Lasting Business Improvement
Read More
A simple solution to user management
Effortlessly Organize Teams and Permissions with Intuitive User Management Tools
Read More
7 Golden Rules for Creating KPI Dashboards
Best Practices for Designing Clear, Effective, and Actionable KPI Dashboards
Read MoreMarketing KPIs you should be tracking
Focus on Actionable Metrics That Drive Real Marketing Performance
Read More
4 Steps to becoming a Productivity Legend
Master Productivity: Four Practical Steps for Lasting Work Efficiency
Read More
4 KPI Dashboards every Sales Leader should have
Dashboards That Give Sales Leaders Actionable Insights and Performance Clarity
Read MoreChristmas Data, KPI Tracking and the Internet of Things
How IoT Devices Transform Holiday Data and KPI Tracking
Read More
Over 200 Essential Key Performance Indicators
Comprehensive KPI Examples to Jumpstart Your Performance Measurement Strategy
Read More
Is your KPI Analysis biased?
Recognize and Overcome Bias for More Accurate KPI Insights
Read More
20 Practical KPI Examples for performance excellence
Real-World KPIs for Measuring and Driving Business Performance Excellence
Read More