Challenges in ancient roots
Search, click, and with quiet simplicity (most of the time), our Amazon packages arrive at our doorsteps.
We take a moment to check that the contents match our orders and that they are still in one piece. Similarly, when picking up fish at the grocery store, we often don’t think about its journey from the water to our shopping cart.
Yet, the supply chain, now capable of spanning mere hours, is as ancient as human trade itself.
Long ago, merchants established supply chains that connected distant lands. The Silk Road facilitated cross-continental trade, allowing goods, ideas, and cultures to interflow between China, Central Asia, and the Mediterranean.
Fast-forward to today: supply chains have accelerated exponentially. From mass production to multinational-orchestrated globalization, the digital age has reshaped how goods traverse the globe. Amid this transformation, demands for transparency, fair labor practices, and sustainability echo louder than ever.
However, modern supply chains come with modern challenges.
The rising cost of living, geopolitical tensions, and disruptions to established trade routes pose obstacles that our distant traders could not imagine.
Rising Cost of Living
Soaring inflation can hit households hard, driving up food costs and making it tougher to afford both the luxuries and the essentials. Uncertainty about demand, caused by shifting consumer behavior, can lead to shortages or higher prices.
Labor Unrest
As workers demand wage increases to offset inflation's impact on their pay, this inevitably leads to Industrial action that disrupts supply chains. Increasing strikes by truckers, shipyard workers, and railway workers can delay deliveries and affect production.
Material Scarcity
Manufacturers rely on a steady material supply. Shortages of raw materials (e.g., glass, plastics, lumber, metals) disrupt production. Scarcity leads to delays and production interruptions.
Congestion at Critical Ports
Overcrowded ports delay shipments. This causes longer lead times, missed delivery windows, and increased transportation costs.
Disruption to traditional trade routes
Geopolitical challenges, such as the recent Houthis attacks on shipping in the Red Sea, the rising Middle East tensions around the Strait of Hormuz, and the simmering tensions along the Strait of Taiwan, can cause detours to shorter trade routes, which in turn increase costs and delivery times.
Increasing Transportation and Freight Costs
Escalating fuel prices and capacity constraints affect logistics. This has profound implications for the supply chain, causing increased shipping costs that impact profitability and pricing.
Digital Transformation and Integration
The need for seamless data exchange across supply chain partners means companies must adopt, invest in, and maintain digital tools.
In navigating these challenges, supply chain professionals must adapt, innovate, and build resilient networks to ensure goods flow efficiently from source to consumer, including a stringent Key Performance Indicator (KPI) strategy.
8 KPIs to help with these challenges.
Let's explore how each of these key performance indicators (KPIs) addresses the modern challenges faced by supply chains:
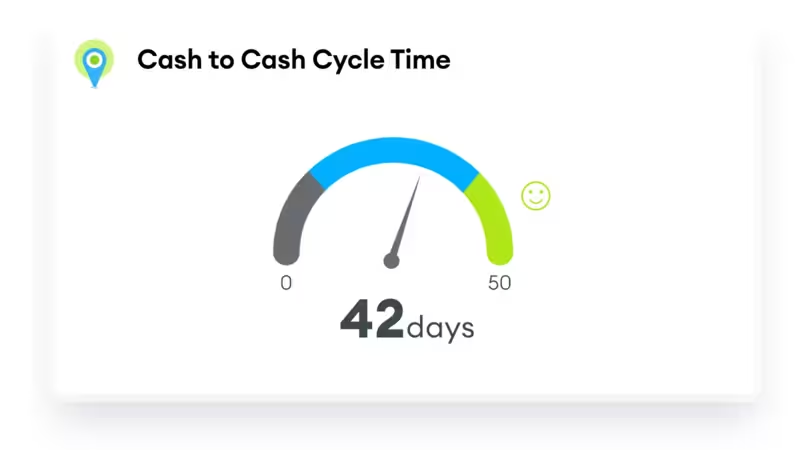
Cash to Cash Cycle Time
By reducing the cycle time, companies can better track cash flow, making financial transactions more transparent. This transparency helps stakeholders understand the economic health of the supply chain.
This KPI aims to provide efficient cash flow management by reducing the need for excessive borrowing or reliance on short-term financing, contributing to long-term sustainability.
This faster cash conversion benefits suppliers, ensuring timely payments and promoting fair trade practices.
Formula:
- The cash-to-cash cycle formula is as follows:
- Cash-to-Cash Cycle = DIO + DSO - DPO
Example Calculation:
- Let’s consider a beauty products brand:
- DIO (Days of Inventory Outstanding) = 41 days
- DSO (Days Sales Outstanding) = 33 days
- DPO (Days Payable Outstanding) = 32 days
Applying the Formula:
- Cash-to-Cash Cycle = 41 + 33 - 32 = 42 days
Service Rate KPI
High service rates demonstrate reliability and transparency to customers. Meeting set service-level agreements fosters trust and openness. This, coupled with Consistent service rates, prevents stockouts, minimizes disruptions, and promotes sustainable customer relationships.
Reliable service rates also reduce the need for emergency shipments, which can have environmental impacts.
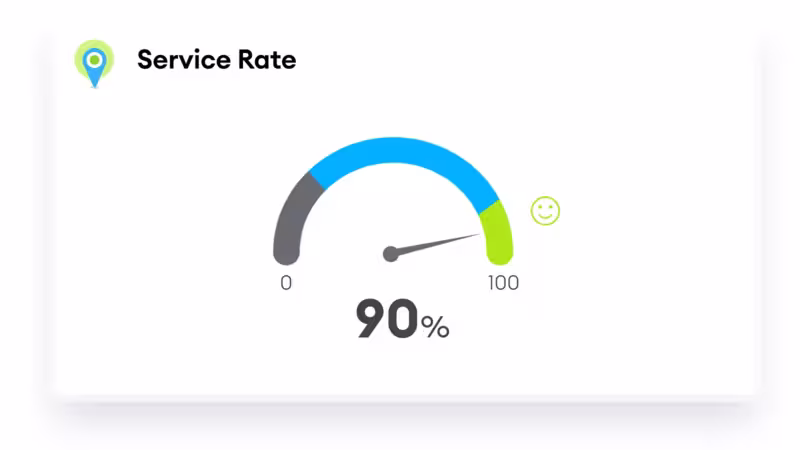
Formula:
- The service rate is expressed as a percentage:
- Service Rate (%) = (Orders Delivered On Time / Total Orders Placed) × 100
Example Calculation:
- Let’s say a company received 500 orders in a month.
- Out of these, 450 orders were delivered on time.
Applying the formula:
- Service Rate = (450 / 500) × 100 = 90%
Interpretation:
A service rate of 90% indicates that 90% of the orders were fulfilled as promised. The remaining 10% may have experienced delays or issues.
Inventory Turnover
Frequent inventory turnover ensures visibility into stock levels. Companies can adjust production and procurement based on demand fluctuations. An optimized inventory turnover reduces waste, prevents overstocking, and minimizes excess inventory disposal. It also leads to efficient inventory management, affecting consumer pricing and affordability.
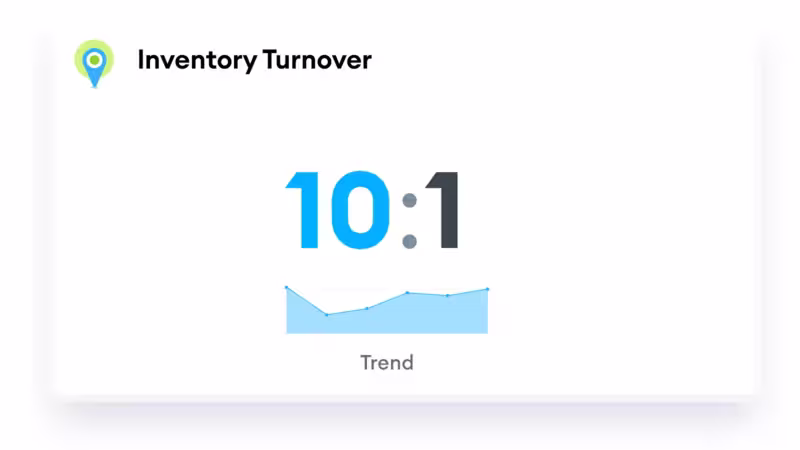
Formula:
- Inventory turnover is expressed as a ratio
- Average Inventory = (Beginning Inventory + Ending Inventory) / 2
- Average Inventory = ($600,000 + $400,000) / 2 = $500,000
Example Calculation:
- Inventory Turnover Ratio = COGS / Average Inventory
- Inventory Turnover Ratio = $5,000,000 / $500,000 = 10 times a year
Inventory Velocity
Faster inventory movement provides real-time insights into supply chain performance. This transparency helps identify bottlenecks and inefficiencies and reduces storage costs, energy consumption, and waste. The lower storage time of goods minimizes the environmental impact of warehousing.
Formula:
Inventory Velocity is calculated by adding the value of inventory from the end of a period to the value of inventory at the beginning of the prior period and dividing the sum by 2.
Example Calculation:
- Average Inventory = (Beginning Inventory + Ending Inventory) / 2
- Average Inventory = ($100,000 + $150,000) / 2 = $125,000
Apply the Formula:
- Inventory Velocity Ratio = COGS / Average Inventory
- Inventory Velocity Ratio = $500,000 / $125,000 =4
Fill Rate
High fill rates demonstrate a commitment to customer satisfaction. Transparent communication about stock availability is crucial in preventing overstocking and reducing waste and resource consumption.
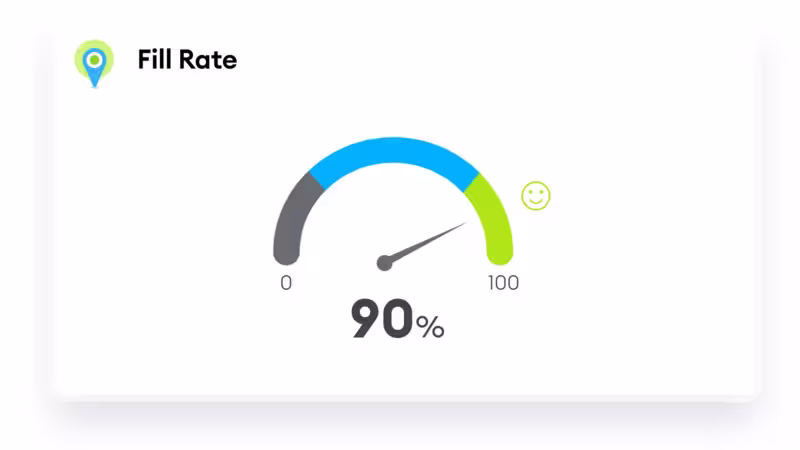
Formula:
- The fill rate is expressed as a percentage:
- Fill Rate (%) = (Total Orders Shipped / Total Orders Placed) × 100
Example Calculation:
- Let’s say your business received 500 orders in a month.
- Out of these, 450 orders were shipped complete without any issues.
Applying the Formula:
Fill Rate = (450 / 500) × 100 = 90%
On-time Delivery Performance
Meeting delivery deadlines enhances transparency and trust with customers.Additionally, timely deliveries reduce rush shipping, lowering the carbon footprint.
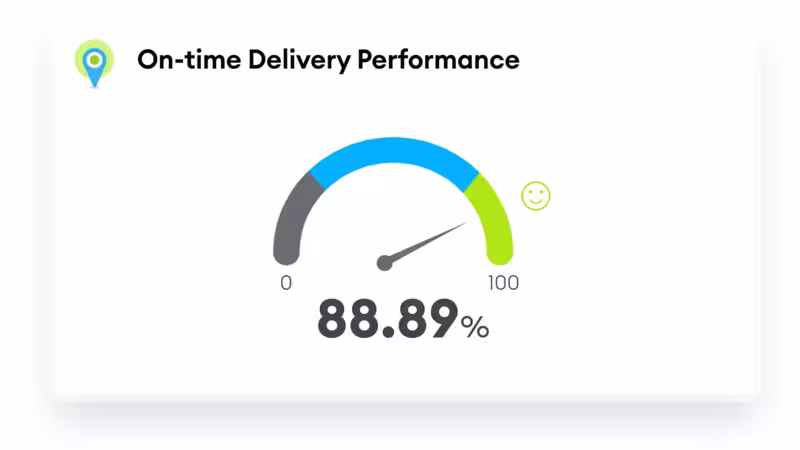
Formula:
- The OTD rate is expressed as a percentage:
- OTD Rate (%) = (Number of Orders Delivered on Time / Total Orders Shipped) × 100
Example Calculation:
- Suppose your business shipped 450 orders during a specific period.
- Out of these, 400 orders were delivered within the promised delivery window.
Applying the formula:
OTD Rate = (400 / 450) × 100 = 88.89%
Perfect Order Rate
Error-free orders demonstrate commitment to quality, and transparency in order processing builds trust. Accurate orders prevent returns, reducing waste and transportation emissions. Perfect orders benefit suppliers by minimizing disputes and rework.
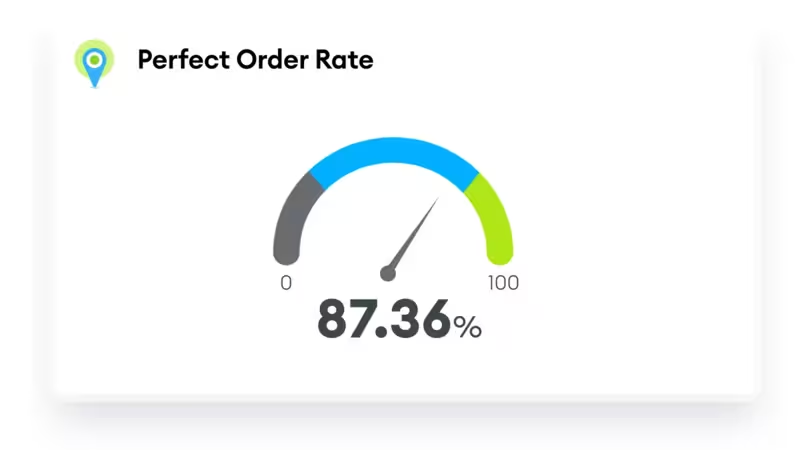
Formula:
- The Perfect Order Rate is expressed as a percentage:
- Perfect Order Rate (%) = (Orders Delivered on Time) × (Orders Complete) × (Orders Damage-Free) × (Orders with Accurate Documentation) × 100
Example Calculation:
Let’s consider a company that shipped 500 orders during a specific period.
Out of these:
- Four hundred fifty orders were delivered on time.
- Four hundred seventy orders were damage-free.
- Four hundred eighty orders were completed.
- Four hundred ninety orders had accurate documentation.
Applying the formula:
- Perfect Order Rate = (450 / 500) × (480 / 500) × (470 / 500) × (490 / 500) × 100
- Perfect Order Rate = 87.36%
Days Sales Outstanding (DSO)
Efficient DSO management ensures transparency in financial transactions. Clear invoicing and payment terms benefit all parties. These timely payments support suppliers' financial stability, and faster payments can positively impact suppliers' livelihoods.
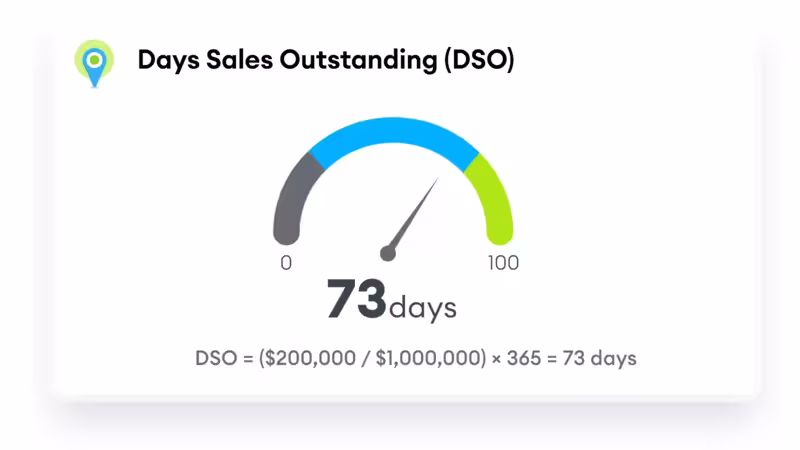
Formula:
- DSO is calculated as follows:
- DSO = (Average Accounts Receivable / Net Revenue) × 365 days
Example Calculation:
Let’s say a company has an average accounts receivable balance of $200,000 and a net revenue of $1,000,000.
Applying the formula:
DSO = ($200,000 / $1,000,000) × 365 = 73 days
All of these KPis can be found on an example Supply Chain KPI Dashboard here.
Finally
The modern supply chain has evolved significantly from its ancient roots, with faster innovations creating new pressures that must be addressed. However, modern supply chains also come with challenges, such as rising living costs, geopolitical tensions, and disruptions to traditional trade routes. These challenges include labor unrest, material scarcity, congestion at critical ports, and geopolitical issues.
Key Performance Indicators (KPIs) play a critical role in addressing transparency, sustainability, fair trade practices, environmental concerns, cost management, and challenges posed by war. By aligning your KPI strategy to combat these challenges, everyone involved in the supply chain will be better prepared to face current and future obstacles.
A well-managed supply chain contributes to a more resilient and responsible global economy. By tackling these challenges head-on, we can make our supply chains more robust and better equipped to face whatever the future holds.

by Stuart Kinsey
Stuart Kinsey writes on Key Performance Indicators, Dashboards, Marketing, and Business Strategy. He is a co-founder of SimpleKPI and has worked in creative and analytical services for over 25 years. He believes embracing KPIs and visualizing performance is essential for any organization to thrive and grow.