ANALYSIS & INSIGHTS
A completely transparent view of your KPIs
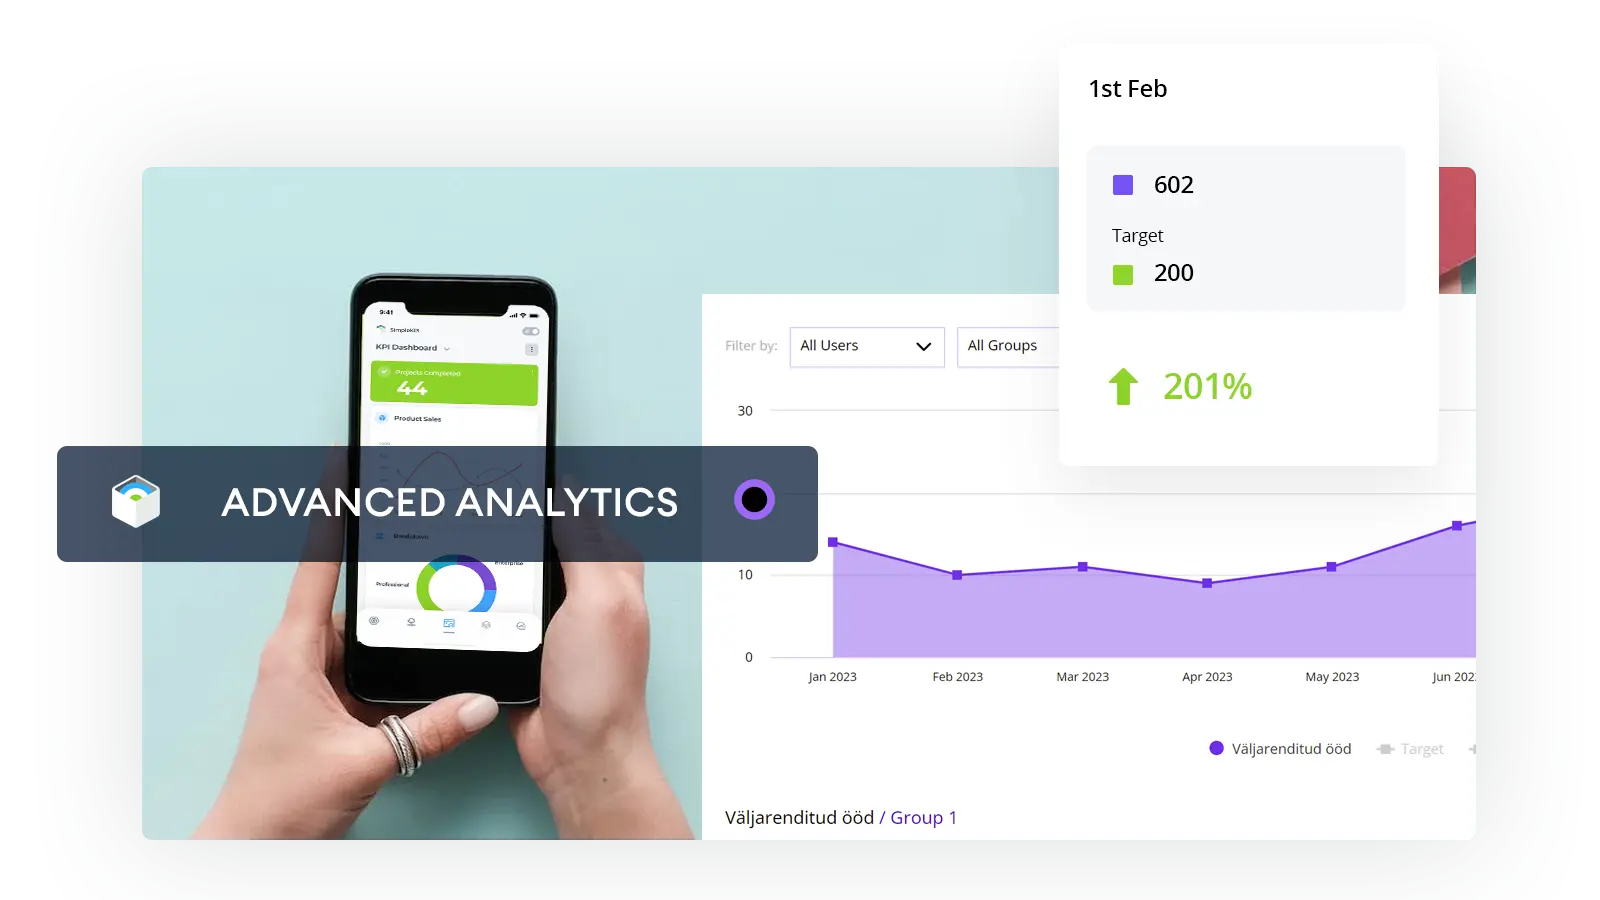
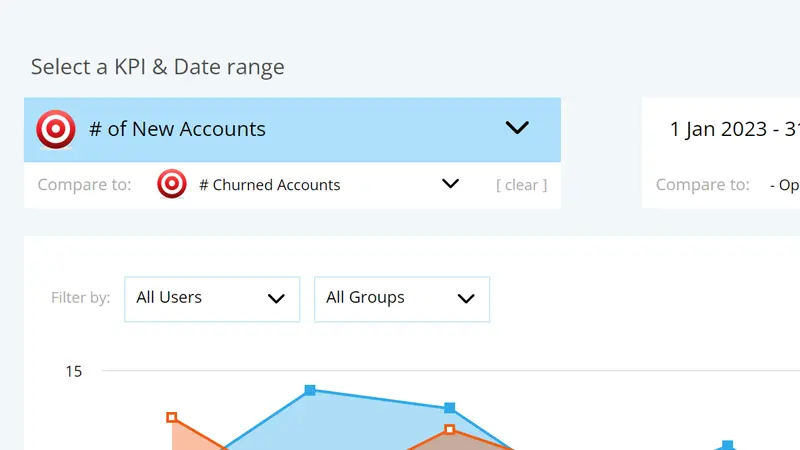
Analyzing those peaks and troughs
Tracking KPIs enables you to make informed management decisions and monitor performance. But when those unexplained peaks and troughs appear in your graphs and charts, it's crucial to have the ability to quickly and efficiently investigate what's going on behind the scenes.
SimpleKPI incorporates a powerful, yet simple to use analysis tool. Quickly distinguish the most important information from the background noise, and discover the real meanings behind the ups and downs.
Greater insights from
your data
Performance monitoring doesn't stop at Dashboards and Reports. Using the metrics and data intelligently can elevate your business to a whole new level.
Insights are gained by using analytics. They allow you to have a deeper understanding of your business, customers, staff and processes. They can also uncover opportunities that would otherwise have gone undiscovered. Conversely, they can highlight areas of a process or performance that could avert disaster.
Having the right tools to make informed decisions provides a clear competitive advantage, and helps propel a business forward.
Discover data insights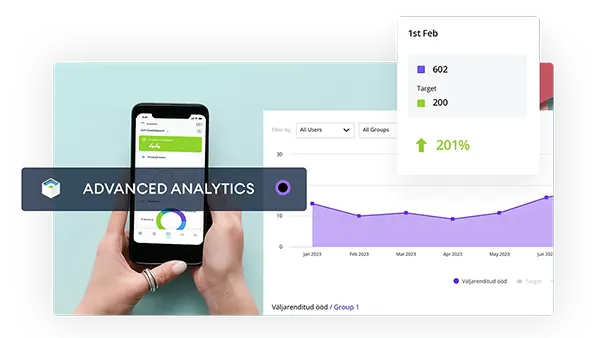
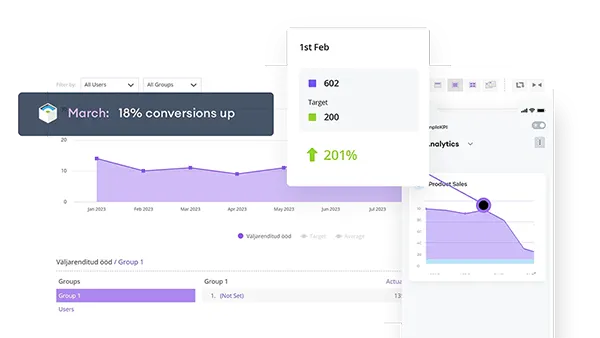
Advanced KPI Analytics
Data is everywhere. From your smartphone to nearly any business process and it's generated in ever increasing numbers. Convenient access to this real-time business data isn't just a 'nice to have', it's now vital in providing organizations with a clear competitive advantage.
Companies are constantly looking to innovate and improve how they use their data to leverage this advantage, increase market share and grow revenues. In this face-paced world of big data, it's not enough to simply monitor and measure KPIs. To truly benefit from your endeavors you need to turn to advanced, modern analytics.
How to analyze KPIs, metrics and measures
Analyzing swathes of data can be a daunting task. SimpleKPI helps highlight areas for analysis and provides the tools to proactively investigate your data. Analyzing KPIs falls into two categories:
- Re-active: If KPIs are designed and visualized correctly they provide triggers for further analysis, such as a spike in the data, an unexpected trend, not hitting a target or even over performance. Any of these visual triggers will prompt re-active analysis of the historical data to confirm the cause.
Pro-active analysis involves investigating the metrics and data behind KPIs operating within normal parameters to:
- Identify and resolve any underlying problems.
- Provides insights to improve processes.
- Uncover opportunities or weaknesses within the business.
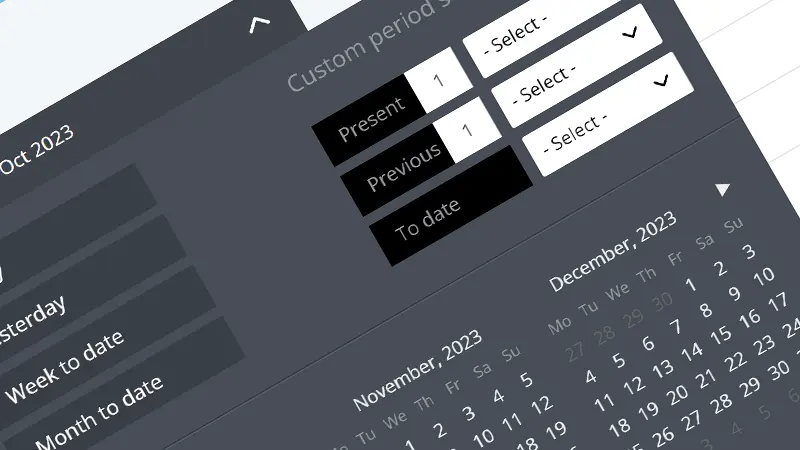
Customized analysis reports
Choose from a variety of standard and custom date periods and set comparison intervals
Save and share
Communicate your insights and analysis findings with colleagues and clients. Export to Excel or PDFs.
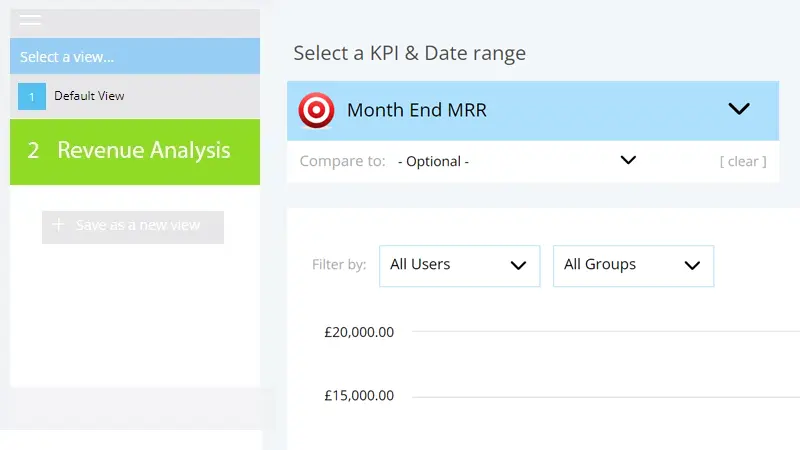
Investigate and discover
Interrogate the data behind your metrics and KPIs across the entire organization from a single place. Quickly identify and access the data behind your charts and graphs.
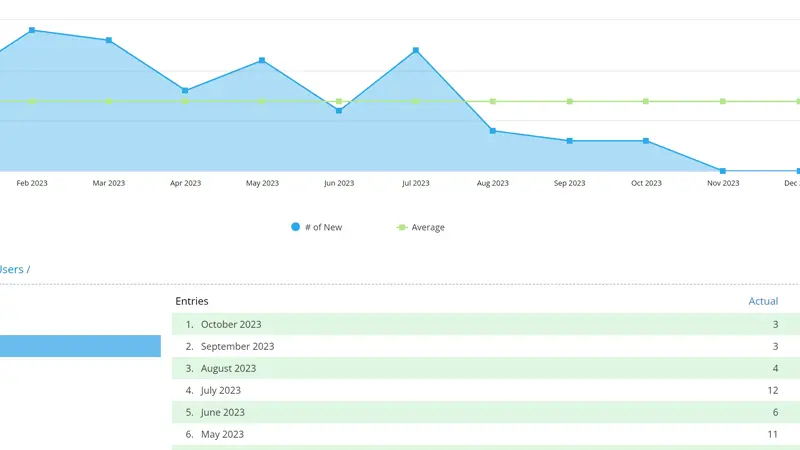
Break down top level measures
See who, how and when data was entered. Filter your results across groups such as countries and business units down to the individuals.
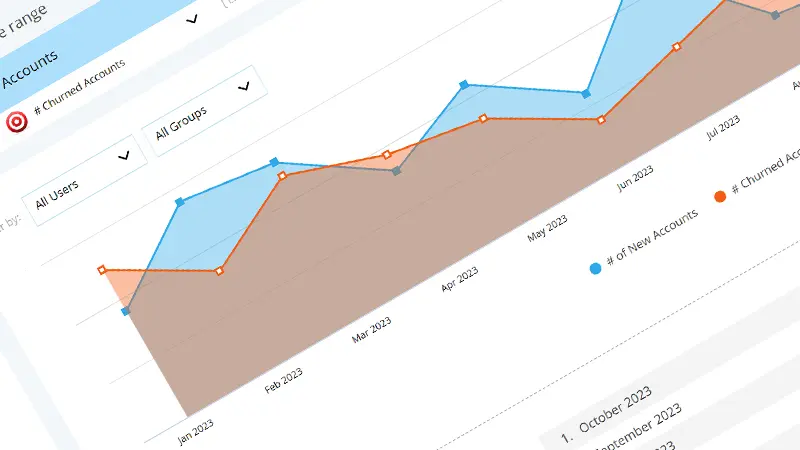
Compare various metrics
Highlight the relationship between your data. What is the impact of higher values against another KPI? Discover the truth behind the data.
Best Practice
When confronted with such an abundance of KPI data, where do you get started? It's tempting to dive straight in, but to avoid common pitfalls it's worth learning some key fundamentals. So, here's 5 pointers to get you started.
5 tips for good KPI Analysis practice:
- Ensure your data is up-to-date and error free. Nothing will guarantee your barking up the wrong tree, or worse that you could come to an entirely opposite conclusion from what the data should be telling you. Check data and accuracy on a regular basis.
- Don't analyze in isolation. Just as most businesses have a symbiotic relationship between departments, so do KPIs. Looking at a KPI in blinkers can give a distorting representation of the truth. For example, sales performance dips may be due to a reduction in marketing budget and not an individual's performance.
- Quality not Quantity. With a near endless supply of data and metrics, it can be difficult to decide what to analyze. Set parameters for analysis triggers, if a KPI or Metric falls outside of these acceptable parameters then it's time to investigate.
- Analyze without prejudice. It's only human nature to use analysis to prove a personal theory or opinion. However difficult it can be, use data to provide information that warrants investigation and explore that data with a broad and open mind.
- Never analyze with a spreadsheet. Interfering with underlying formulas, missing data handling and ultimately 'it was never intended to be an analysis tool', are just a few reasons to avoid using spreadsheets to analyze data. They are a great tool for raw data management, but fall way short in terms of the functions needed to efficiently and accurately analyze your KPIs.
KPI Analytics involves the objective examination, transformation, and modeling of Key Performance Indicators. This analysis entails evaluating KPI performance against predetermined targets and goals. Visual representations such as graphs, charts, and tables are utilized to present the data, facilitating the identification of insights and aiding in decision-making.
Yes, you can use the KPI analysis tools to look into raw data and metrics you use to make up your KPIs.
Yes, SimpleKPI supports exporting to PDF and Excel formats. You can also save and share your KPI analytics views with other users.