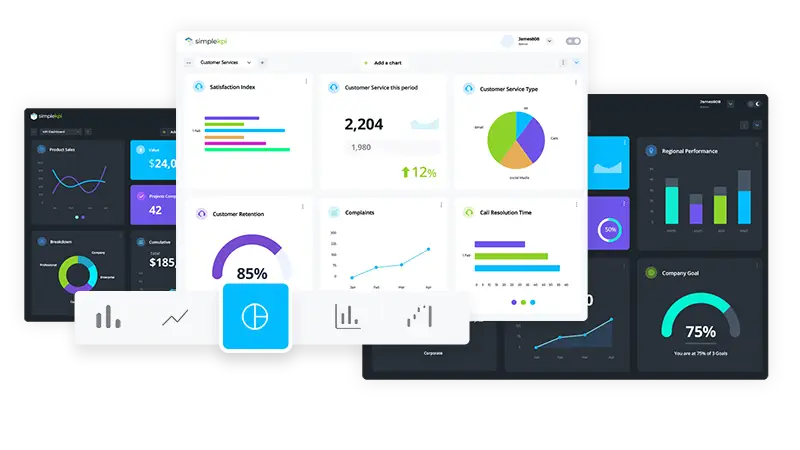
Benefit from a range of industry-focused KPI dashboards
It's always great to get a kick start on any business process. From pre-built financial reports to email marketing templates, these little gems of knowledge save precious time and effort, offer valuable tips, and provide alternative methods of doing things we may have missed.
So, we've compiled expert-inspired dashboard examples from various industries and departments. They are flexible, highly customizable, and easy to implement, so both beginners and performance experts can benefit from a solid starting point for tracking KPIs, metrics, or business data.
New to KPI dashboards? Before exploring the examples, read our complete guide to KPI dashboards to understand the fundamentals
Choose your KPI Dashboard
View all Dashboard Examples
Advertising KPI Dashboard
Optimize your advertising strategy with our Advertising KPI Dashboard. Track key performance metrics such as Cost Per Click (CPC), Click-Through Rate (CTR), Return on Ad Spend (ROAS), and more to maximize your ad efficiency and profitability.
Advertising KPI dashboard example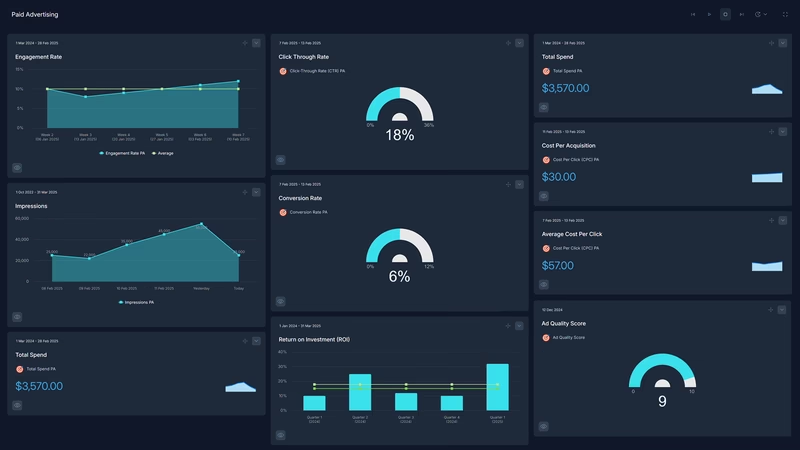
Architect KPI Dashboard
Elevate your architecture firm's performance with our Architect KPI Dashboard. Track metrics like project completion rate, client satisfaction, design accuracy, employee utilization, profit margin, and more to streamline workflows, improve decision-making, and enhance client satisfaction.
Architect KPI dashboard example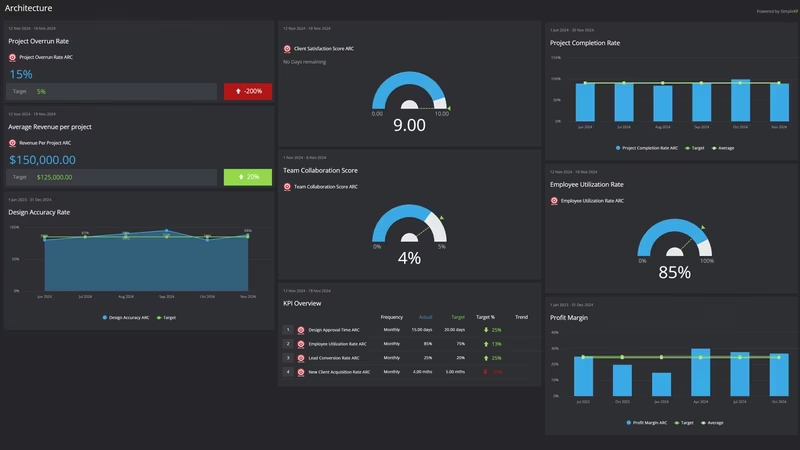
Automotive KPI Dashboard
The KPI Dashboard example is designed for the automotive industry. It aims to help tackle the challenges facing this rapidly evolving industry, such as keeping on top of production costs, managing resources, and covering efficiency aspects such as waste and energy usage.
Automotive KPI dashboard example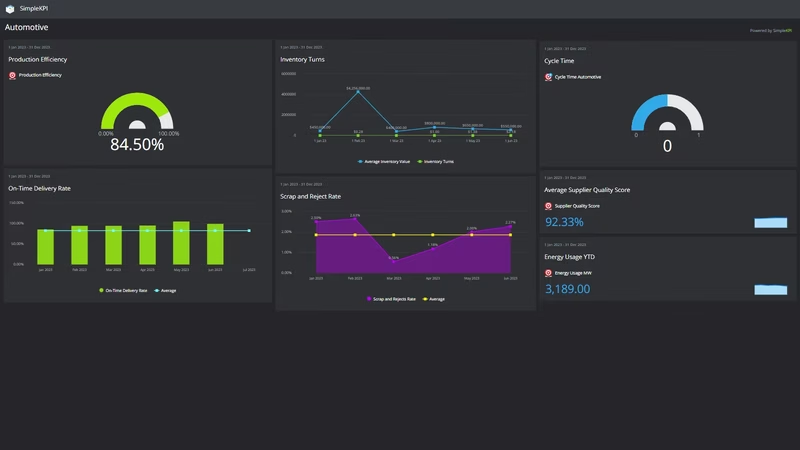
Boutique Hotel KPI Dashboard
The Boutique Hotel dashboard is a tool that centralizes all rental activities and financial data. It assists in tracking key metrics like Average Daily Rate, Revenue Per Available Room, operating expenses, and labor costs, which are sometimes overlooked.
This dashboard is particularly useful for individuals who manage and maintain short-term rental properties, as it prioritizes which metrics to focus on.
Boutique Hotel KPI dashboard example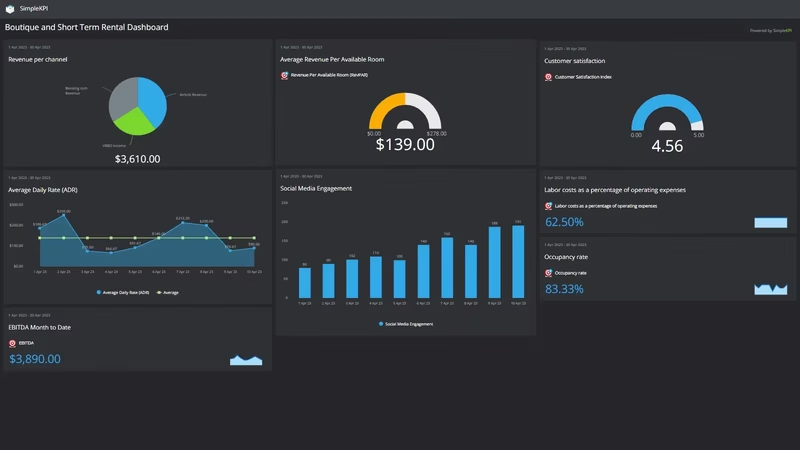
Essential Business KPI Dashboard
For any business, tracking performance is as essential as functions such as sales and customer service. For some, this comes naturally; for others, it can be a daunting prospect. What to track? When to track it? And how to display it are just some of the questions that can have business owners reeling at the prospect.
This dashboard is designed with simplicity in mind. Its five essential and industry generic KPIs get businesses into performance tracking habits - without a prolonged planning period. These KPIs can also act as a base for expanding your KPI tracking and form part of the 5 essential KPIs challenge.
Essential Business KPI dashboard example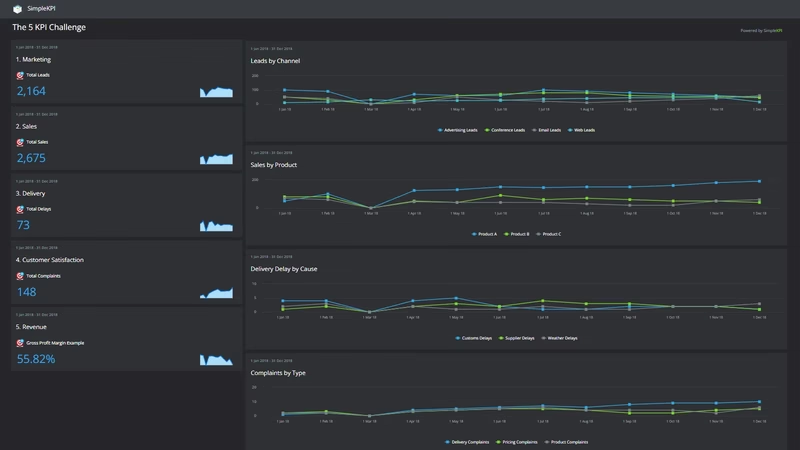
Coffee Shop KPI Dashboard
With the explosion of coffee shops over the last ten years, the Coffee environment has become incredibly competitive. Company owners need to monitor costs more than ever, offer added value, and increase customer loyalty.
Tracking KPIs that help with these fundamentals on a Coffee-Shop-inspired dashboard can benefit owners and staff.
Quickly monitoring Revenue by orders, Expenses, Employee performance, and customer loyalty KPIs helps streamline the process of coffee shop management.
Coffee Shop KPI dashboard example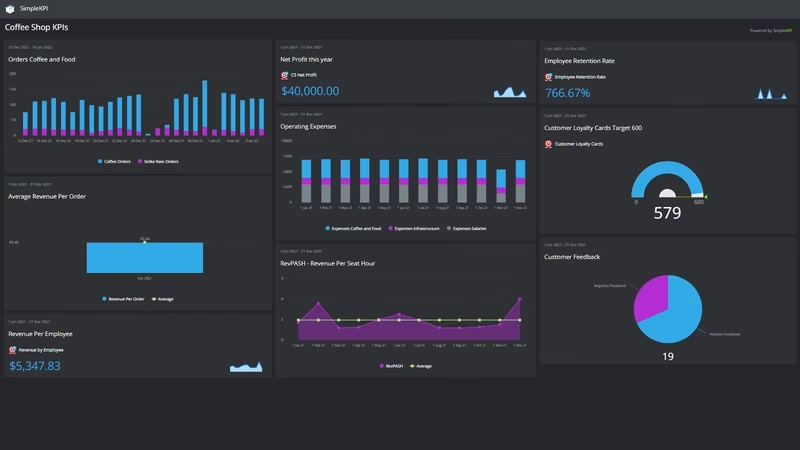
Community Wind Energy Project Impact Dashboard KPI Dashboard
Community-owned wind energy projects deliver clean power, local income, and environmental wins, but success hinges on precise performance tracking. This **Community Wind Energy Project Impact Dashboard** centralizes **Turbine Availability**, **Carbon Savings**, and **Local Financial Returns** to prove ROI and sustain member buy-in.
Community Wind Energy Project Impact Dashboard KPI dashboard example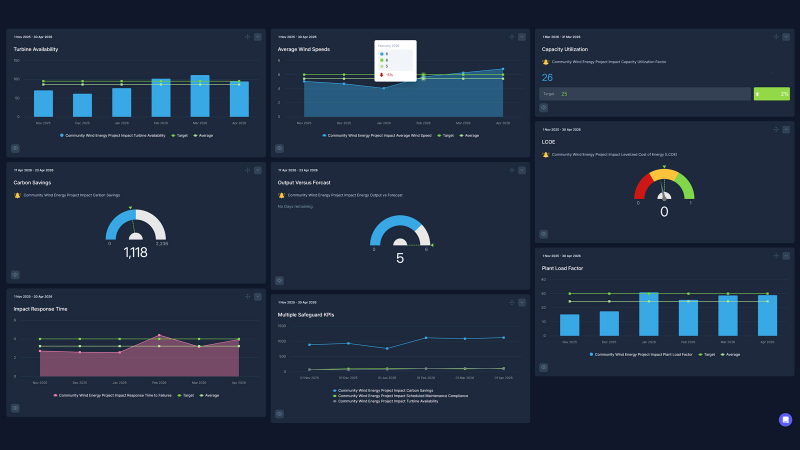
Construction Project Performance KPI Dashboard
Take control of project outcomes with our Construction Performance Dashboard. Monitor real-time progress, safety, and cost variance to keep every job site running smoothly.
Construction Project Performance KPI dashboard example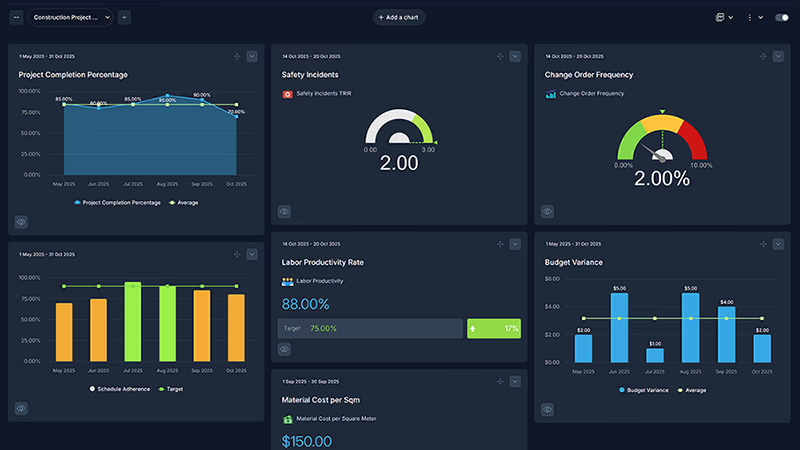
Corporate Social Responsibility KPI Dashboard
The CSR Corporate and Social Responsibility Dashboard is designed to help companies track and manage their sustainability and ethical initiatives with real-time, actionable data. As businesses face growing demands from stakeholders to adopt responsible practices, it’s more important than ever to ensure these efforts are not only impactful but also measurable.
With this dashboard, you can monitor key performance indicators (KPIs) that reflect your organization’s commitment to the environment, community, and workplace diversity.
Corporate Social Responsibility KPI dashboard example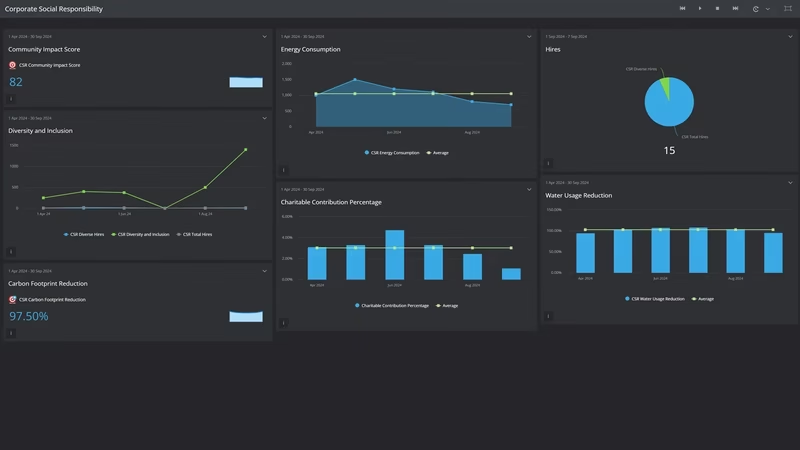
Creator KPI Dashboard
Elevate your performance as a creator with our Creator KPI Dashboard. Track metrics like conversion rate, engagement quality, brand partnership renewal rates, and more to thrive in the competitive creator economy.
Creator KPI dashboard example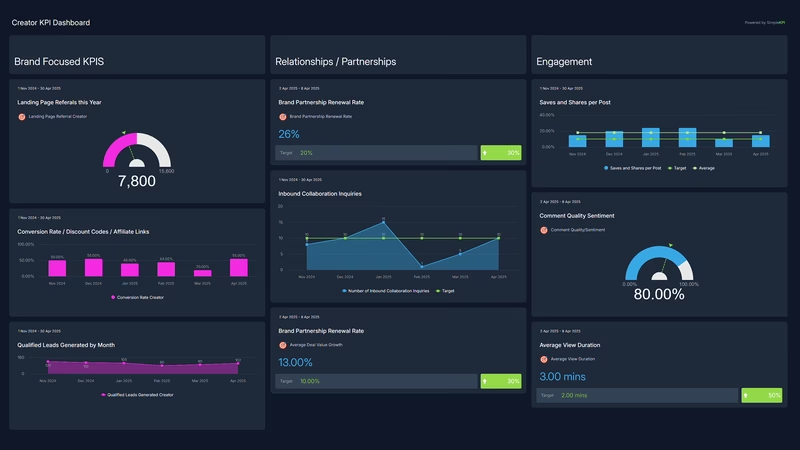
Customer Service KPI Dashboard
Merely relying on customer satisfaction surveys is not enough to gauge your support success.
Keeping customers happy and informed is the number one factor in retaining them as customers. Tracking and visualizing the right customer service KPIs on a dashboard will highlight areas within your department where your both excelling and under-performing, allowing you to adapt or add processes that best help their needs.
Customer Service KPI dashboard example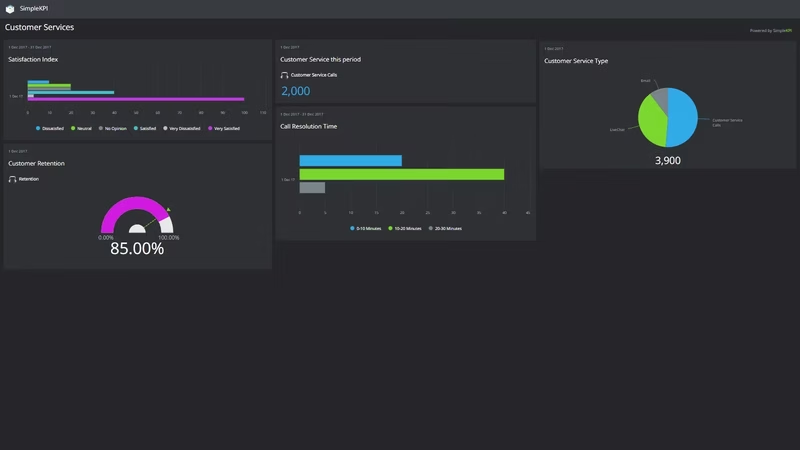
Dental Practice Performance KPI Dashboard
Track patient flow, clinical production, and financial health in one place. This Dental Practice Dashboard helps owners and office managers see what’s working, spot scheduling bottlenecks, and improve collections.
Dental Practice Performance KPI dashboard example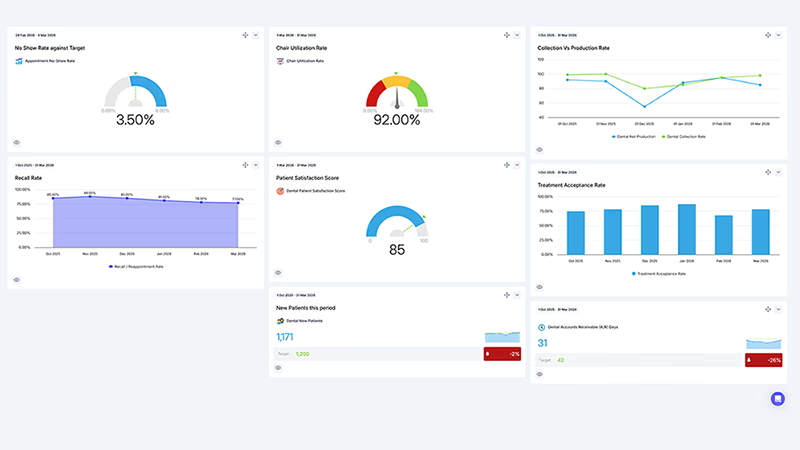
Eco Farm Startup KPI Dashboard
Optimize your eco-farming operations with our Eco Farm Startup KPI Dashboard. Track key sustainability metrics such as crop yield, water usage efficiency, soil health, carbon footprint reduction, and community engagement to drive growth and environmental impact.
Eco Farm Startup KPI dashboard example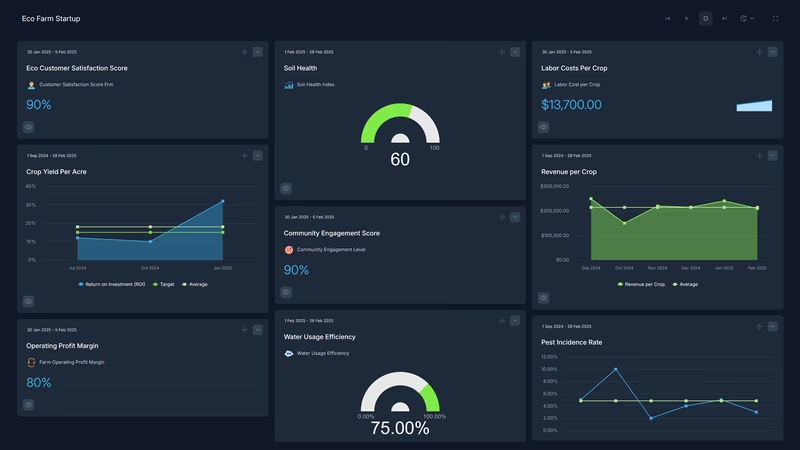
E-Commerce KPI Dashboard
This E-commerce dashboard is a great way to track the Key Performance Indicators needed to monitor the almost constant stream of data generated from online sales. Connect all the disparate elements such as transactions, website metrics, and marketing channels into a single, easy to understand narrative of your data. Translate these insights into actionable goals that will accelerate your online business.
E-Commerce KPI dashboard example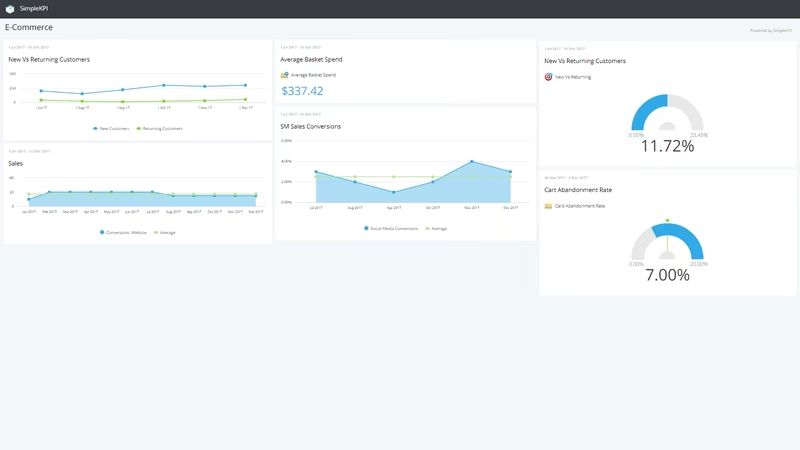
Education KPI Dashboard
An Education KPI Dashboard centralizes all vital metrics for academic performance and operational efficiency. From student enrollment and graduation rates to teacher-student ratios and budget allocation per student, this dashboard tracks essential Key Performance Indicators (KPIs) for educational institutions. It provides a comprehensive view of student success, resource utilization, parental involvement, and digital learning adoption, enabling educators and administrators to enhance educational outcomes and efficiently manage resources.
Education KPI dashboard example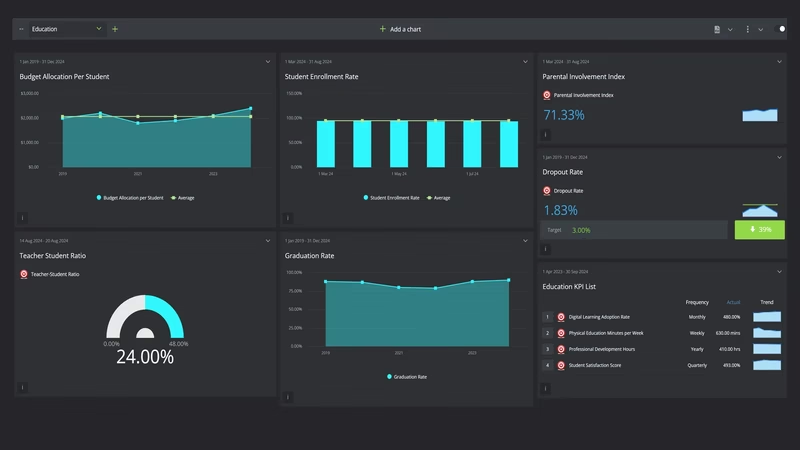
Energy Management KPI Dashboard
An Energy Management KPI Dashboard centralizes critical metrics for monitoring energy consumption, efficiency, and sustainability. From total energy consumption and cost per unit to renewable energy usage and carbon emission reduction rates, this dashboard tracks essential Key Performance Indicators (KPIs) for businesses focused on optimizing their energy usage. It offers a comprehensive view of energy performance, conservation efforts, and environmental impact, empowering organizations to reduce costs, improve efficiency, and meet sustainability goals.
Energy Management KPI dashboard example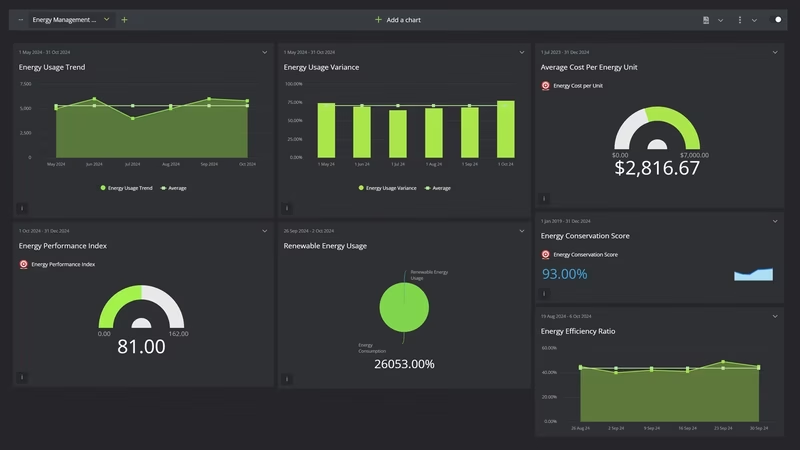
Engineering Project Management KPI Dashboard
Our Engineering Project Management KPI Dashboard is designed to help you track key performance metrics in engineering projects, such as project completion, resource utilization, on-time delivery, and budget adherence. These KPIs provide actionable insights that drive successful project outcomes.
Engineering Project Management KPI dashboard example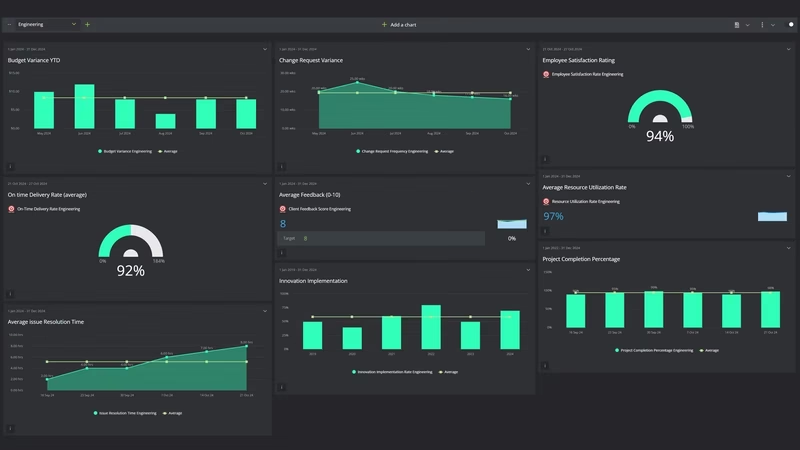
Environmental Sustainability KPI Dashboard
Monitor your organization’s environmental footprint with our Sustainability Management Dashboard. Easily track carbon emissions, energy, waste, and more—all in one place.
Environmental Sustainability KPI dashboard example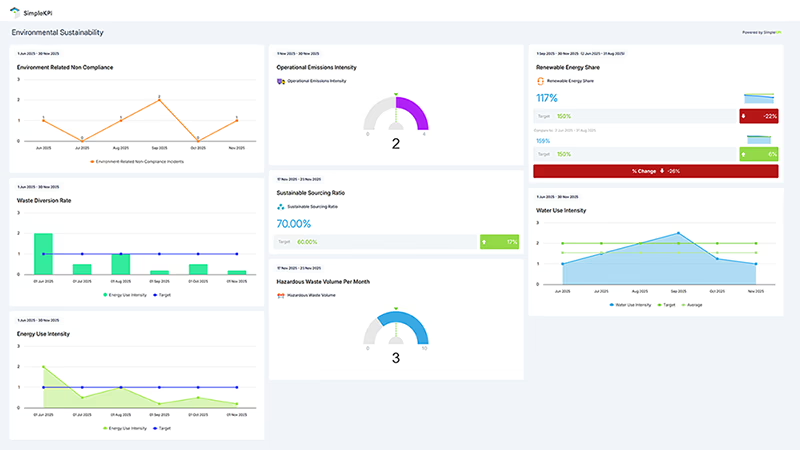
Film Production KPI Dashboard
Optimize your film production process with our Film Production KPI Dashboard. Track metrics such as production cost per film, filming days, audience ratings, ROI, market share, and more for streamlined operations and better decision-making.
Film Production KPI dashboard example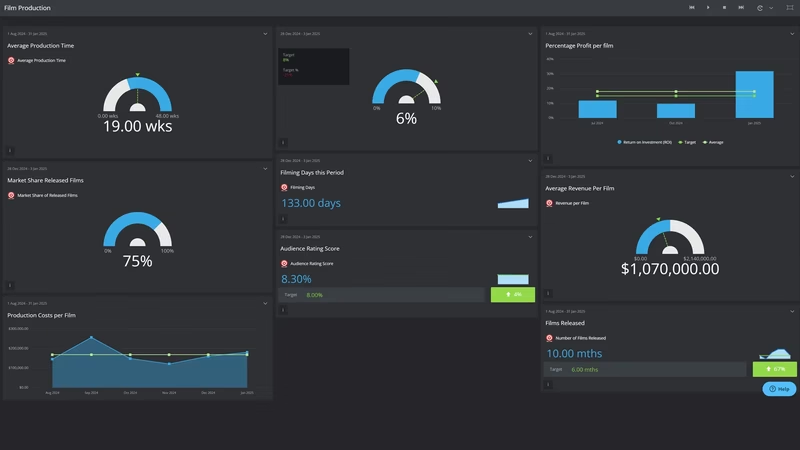
Financial KPI Dashboard
A Financial Dashboard is a crucial tool for making decisions that will affect a company's future finances. They often take complicated financial KPIs such as revenue, expenses, and tax calculations and turn them into easy to understand, actionable visuals. They are providing an instant view of the organization's financial health.
Financial KPI dashboard example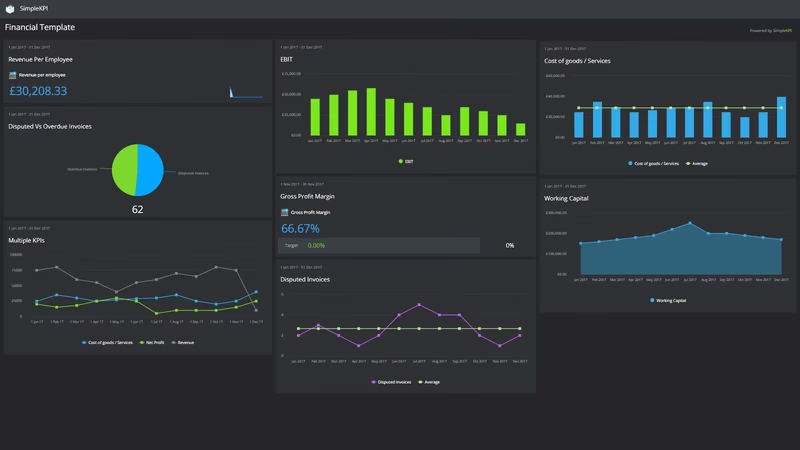
Fitness Club KPI Dashboard
Unlike other business models, Fitness Clubs rely on a blend of Membership / Subscription, seasonality, and personal endeavor to operate efficiently.
This unique model faces many challenges due to its susceptibility to environmental factors outside its control.
Tracking KPIs around retention and revenue is vital for making strategic decisions that offer the best foundation for growth.
Key to this growth strategy is measuring and monitoring KPIs such as Client retention to increase profits or Lead conversion rates to maximize return on advertising investment.
Fitness Club KPI dashboard example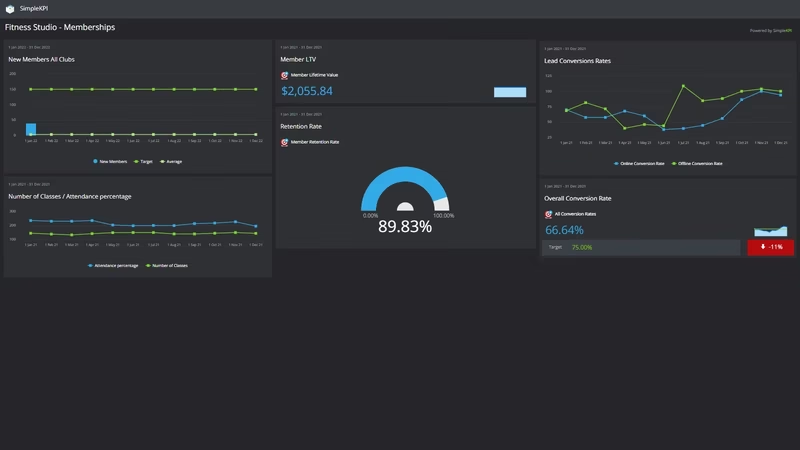
Fleet and Transport KPI Dashboard
Take control of your fleet’s performance with our Fleet & Transportation Management Dashboard. Track fuel efficiency, vehicle utilization, maintenance costs, and more-all in one place.
Fleet and Transport KPI dashboard example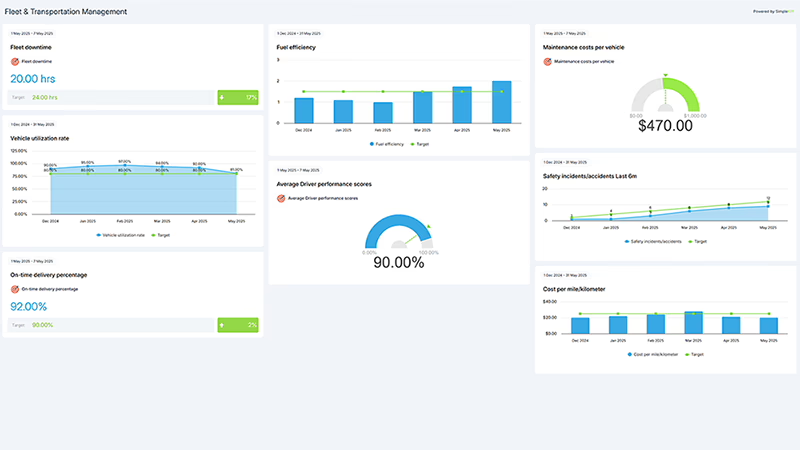
Freelance and Gig Economy KPI Dashboard
Gain valuable insights into your freelancing or gig-based business with our Freelance and Gig Economy KPI Dashboard. Track critical metrics such as Gross Earnings, Client Satisfaction Score, Project Completion Rate, and more to ensure steady growth and client success.
Freelance and Gig Economy KPI dashboard example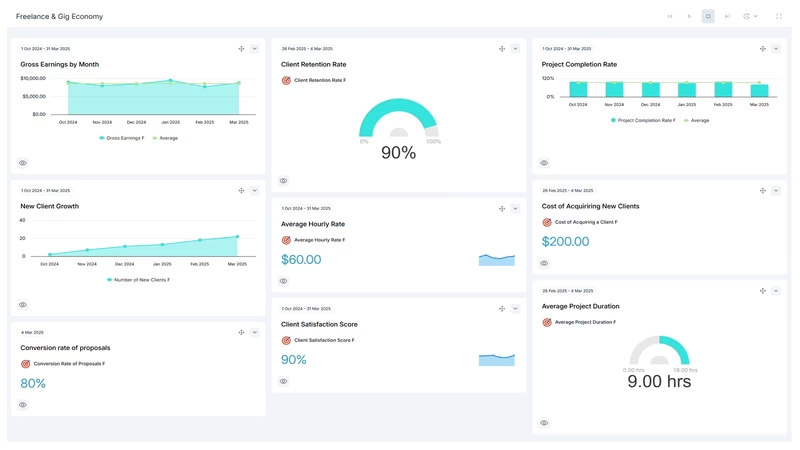
Gaming KPI Dashboard
Track and optimize player engagement, retention, and monetization with our Gaming KPI Dashboard. Monitor key metrics like DAU, ARPU, LTV, Churn Rate, and In-Game Purchase Conversion to drive game success.
Gaming KPI dashboard example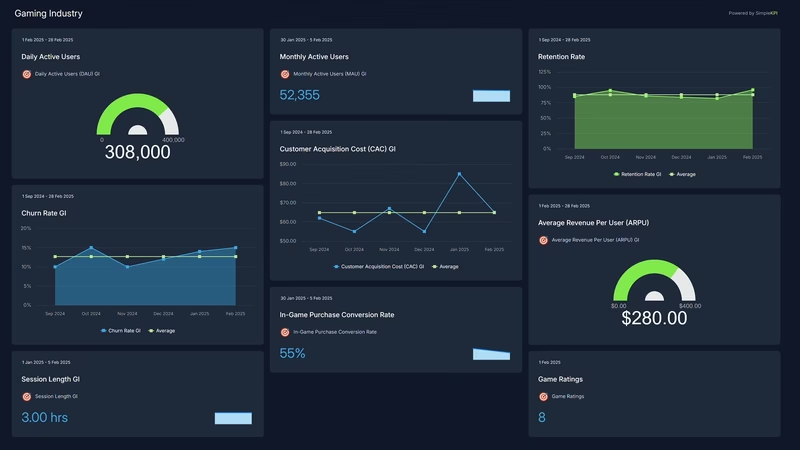
Golf Clubs KPI Dashboard
Maximize your golf club’s potential with our comprehensive KPI Dashboard. Monitor performance trends, membership data, and revenue streams to ensure operational excellence year-round.
Golf Clubs KPI dashboard example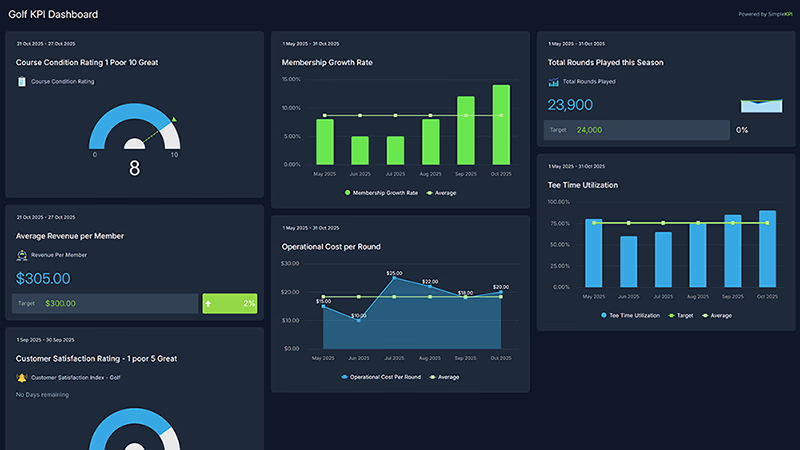
Human Resources KPI Dashboard
Like so many of today's business departments, Human Resources manage an ever-increasing variety of tasks. With this dashboard, you can focus on keeping on top of staffing needs, reducing absenteeism, and increasing productivity. Overall recruitment effectiveness, both external and internal, can also be monitored - and the success of those strategies optimized to reduce costs.
Human Resources KPI dashboard example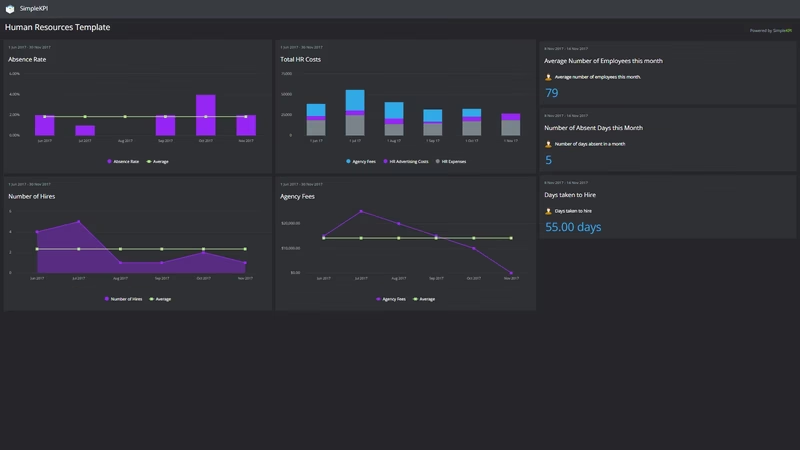
Innovation Management KPI Dashboard
Monitor key innovation metrics such as idea generation, pipeline velocity, R&D ROI, and time-to-market to optimize your innovation strategy and drive growth.
Innovation Management KPI dashboard example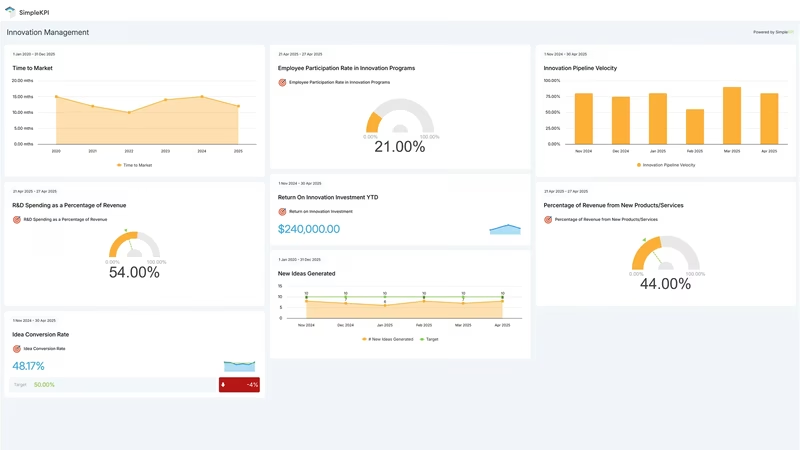
Insurance Claims KPI Dashboard
The Insurance Claims KPI Dashboard is an essential tool for insurance professionals, providing a comprehensive overview of key metrics that impact claims management. This dashboard tracks critical KPIs, including claim frequency, processing time, settlement ratios, and customer satisfaction, to help optimize operations, reduce costs, and improve customer service. Whether you’re an insurance analyst, claims manager, or executive, this dashboard offers valuable insights to drive efficiency and ensure that your claims processes are running smoothly and effectively.
Insurance Claims KPI dashboard example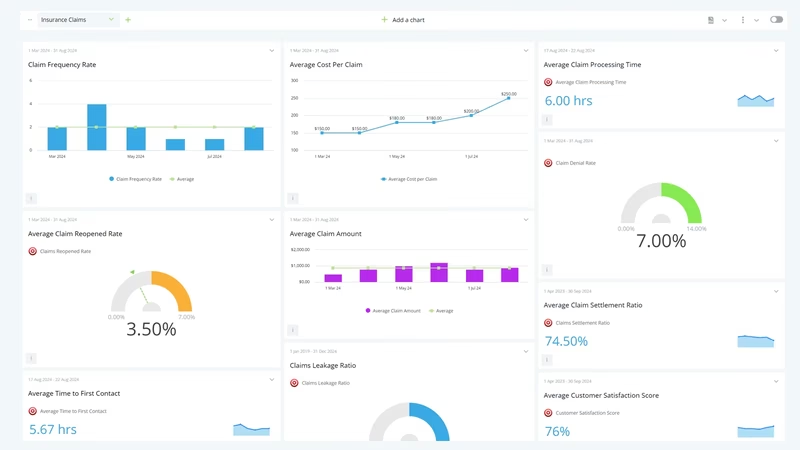
IT KPI Dashboard
An IT Operations dashboard centralizes all critical IT service metrics. From server uptime and incident resolution times to backup success rates and resource utilization, this dashboard tracks essential Key Performance Indicators (KPIs) for IT performance. It provides a comprehensive view of network health, hardware reliability, software compliance, and cost efficiency, enabling IT teams to ensure optimal system performance and quick issue resolution.
IT KPI dashboard example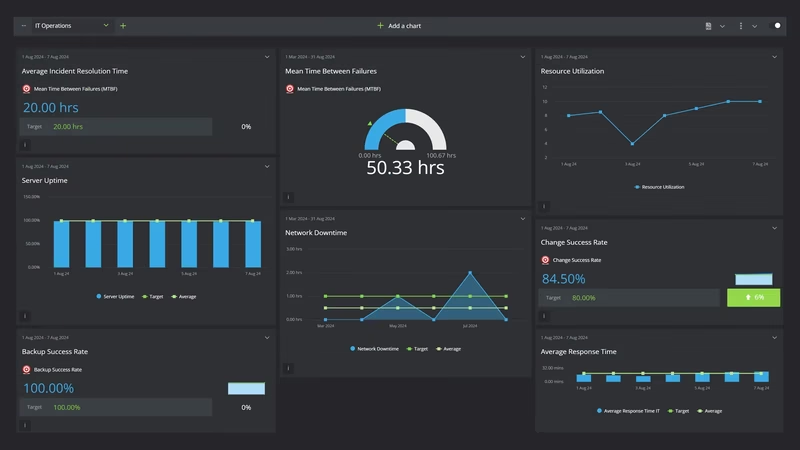
Law Firm KPI Dashboard
Running a successful law firm means balancing client outcomes with business performance. This Law Firm KPI Dashboard helps partners and practice managers track the metrics that matter most, from billable hour utilisation and matter profitability to client acquisition costs, case win rates, and staff productivity. Get a clear, real-time picture of your firm's financial health and operational efficiency in one place
Law Firm KPI dashboard example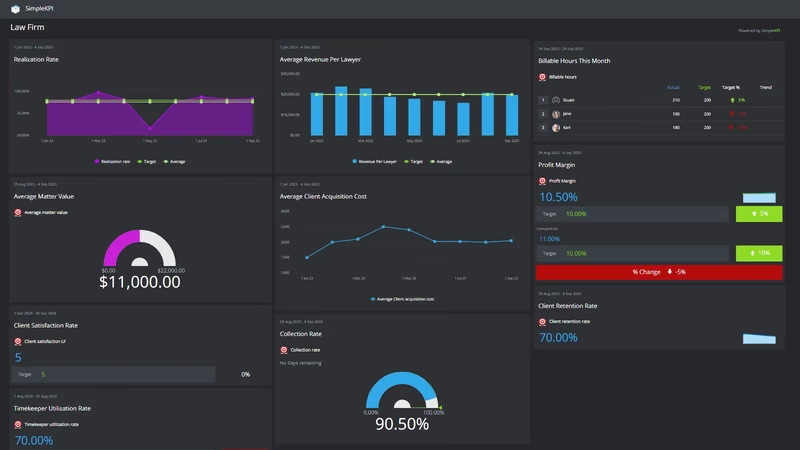
Local Government KPI Dashboard
Our Local Government KPI Dashboard helps monitor essential metrics for effective public service. Track budget utilization, citizen satisfaction, and service delivery timeliness to ensure efficient and responsive governance.
Local Government KPI dashboard example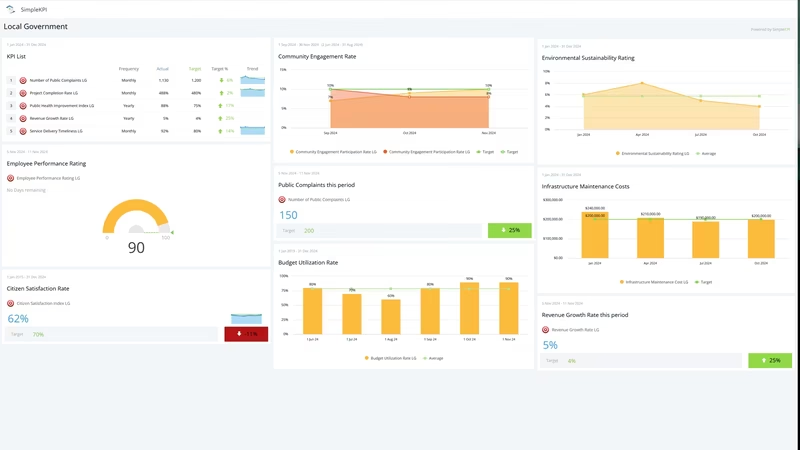
Manufacturing KPI Dashboard
In the manufacturing industry, efficiency is king. Ensuring that machines and processes are running at their optimum can be the difference between success and failure. Monitoring capacity and productivity data is the first step. Turning this data into easy to understand visuals such as graphs and charts on a dashboard is the second - and an essential part of the optimization process. Use KPIs and metrics to spot any potential problems in the process and uncover opportunities to grow.
Manufacturing KPI dashboard example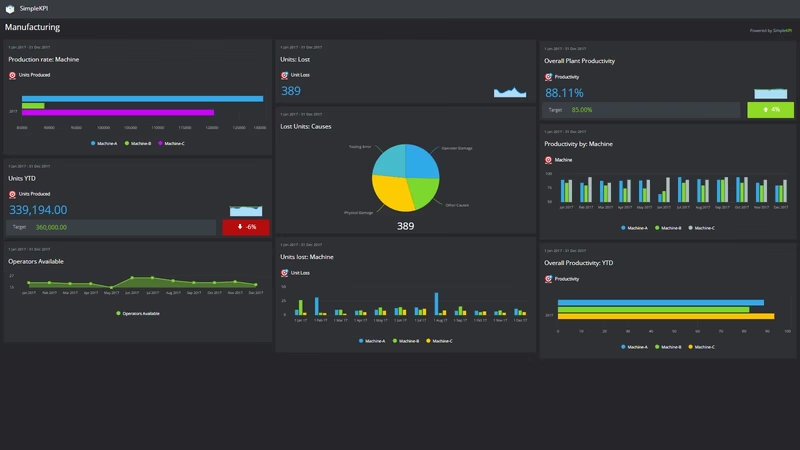
Marketing KPI Dashboard
A Marketing dashboard is a single point of focus for all your marketing channel activities. From traditional forms of lead generation through to email and social media marketing - just about every kind of digital endeavor can be tracked with metrics or Key Performance Indicators.
Marketers get a complete understanding of the cost and success of these promotions, campaigns, and channels.
Marketing KPI dashboard example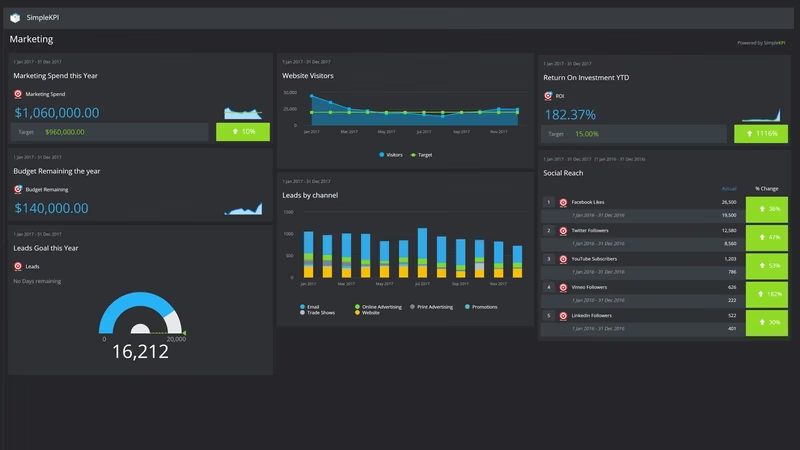
Media and Comms KPI Dashboard
In the dynamic media and communications landscape, companies grapple with the dual challenge of remaining relevant and maximizing impact.
This Media and Communications KPI Template is designed to overcome these challenges and improve performance.
The template consolidates critical KPIs, offering a panoramic view of your organization's well-being. From Total Revenue to Churn Rate, each metric contributes to the overarching narrative. Align your endeavors with organizational objectives by monitoring Total Subscribers, New Customers, and Customer Lifetime Value. Dive into audience understanding with metrics like Net Promoter Score and Customer Retention Rate.
Media and Comms KPI dashboard example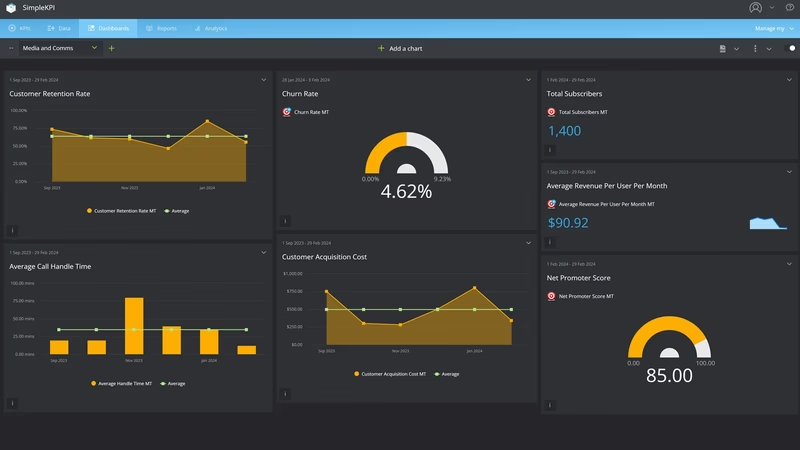
Non-Profit KPI Dashboard
This KPI dashboard template is designed specifically for non-profit organizations that rely on donations and funding to sustain their operations. It is aimed at organizations that provide goods and services, which can be either public or governmentally funded. In this highly finance-sensitive environment, keeping donors, volunteers, and finances in balance is key to success. This dashboard provides a single point of focus to keep the health of the non-profit at the forefront. From tracking and measuring volunteer satisfaction to donor conversion rates, this dashboard has the most important non-profit KPIs in mind. It is an essential tool for non-profits to monitor their performance and make data-driven decisions to achieve their goals.
Non-Profit KPI dashboard example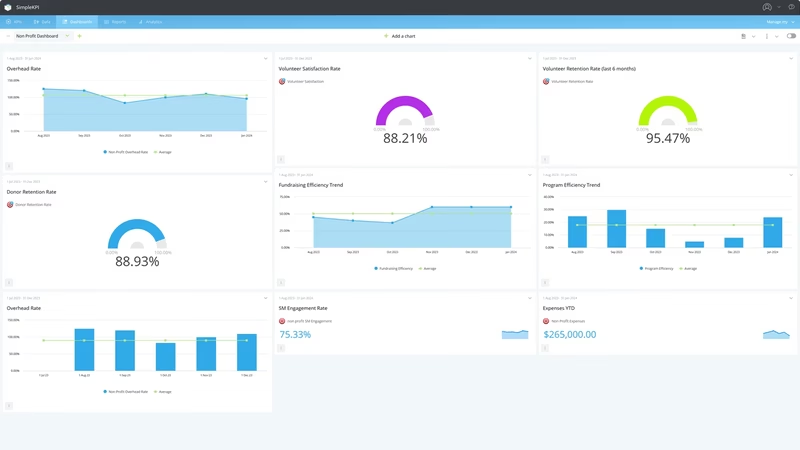
Personal Development KPI Dashboard
Track your personal growth with our comprehensive Personal Development KPI Dashboard. Designed to monitor key metrics such as books read, meditation time, new skills acquired, and productivity, this dashboard helps you stay focused on self-improvement and personal achievement.
Personal Development KPI dashboard example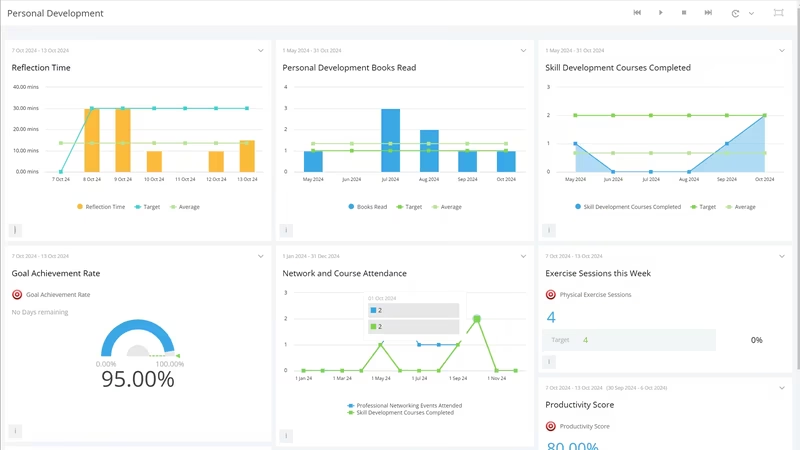
Production KPI Dashboard
Tracking Production KPIs along each step of the production process is vital to ensure efficiency, productivity, and financial stability.
While many production lines manage the data required to monitor and improve the day-to-day running of their manufacturing process, some do not. Production Dashboards offer a simple and efficient way to consume all that data in a concise and simple-to-understand visualization of those processes. Seeing production volumes at a glance alongside demand allows operators to plan for peaks and troughs in production. At the same time, management benefits from tools to see trends that improve processes and costs.
Production KPI dashboard example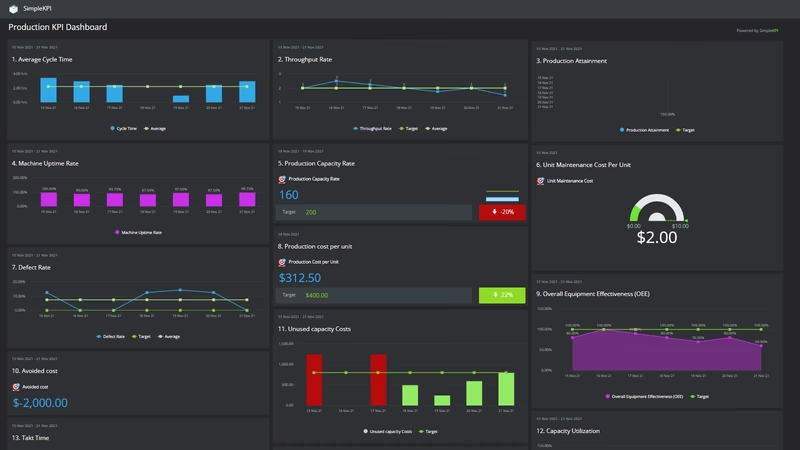
Public Sector KPI Dashboard
This Public Sector KPI Dashboard is designed to be used by government officials to monitor, evaluate, and improve the performance of their authority.
Where budgets and community benefits go hand in hand, a platform to monitor and measure the effectiveness of public sector work and workers is vital. Maximizing budget return, providing real 'measurable' value, and working towards efficiency can all be tracked on this dashboard.
It also provides a clear and concise tool for showcasing the performance of the authority to its constituency members and citizens so that they can clearly see how initiatives, projects, and budgets are performing.
Public Sector KPI dashboard example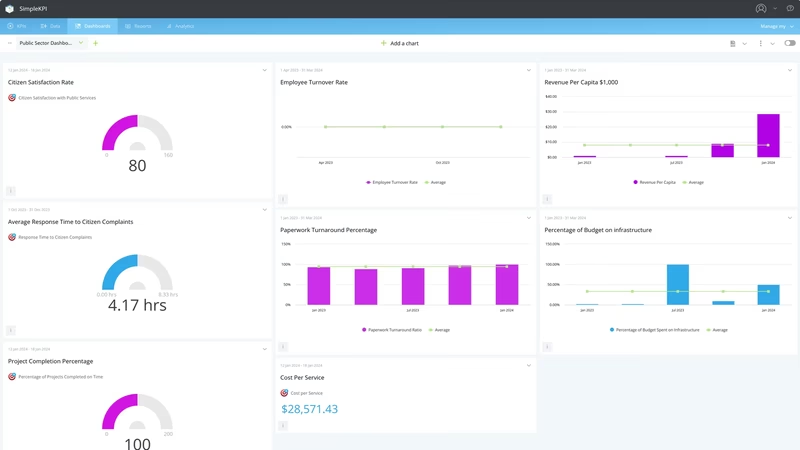
Remote Working KPI Dashboard
Empower your remote workforce with our Remote Working KPI Dashboard. Track key performance metrics such as Employee Productivity Rate, Work-Life Balance Score, Collaboration Tools Usage, and more to ensure an engaged and efficient remote team.
Remote Working KPI dashboard example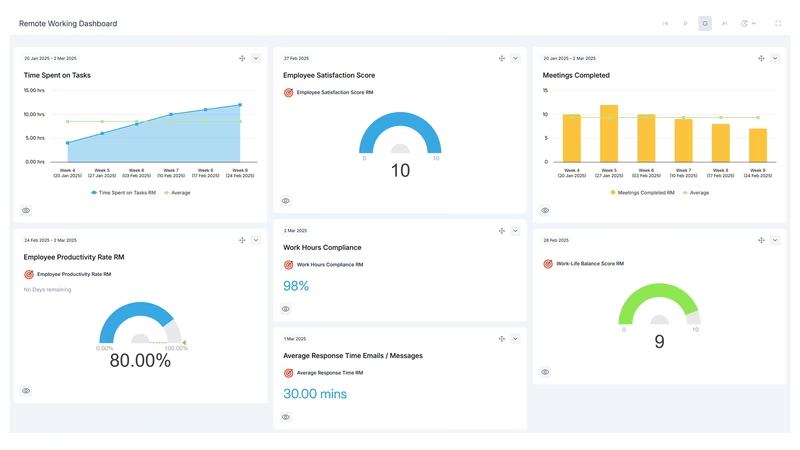
Rental and Lettings KPI Dashboard
Keeping on top of those Key Indicators associated with renting and letting properties to tenants can be a complicated process.
This KPI Dashboard pulls all the detailed data regarding renting and letting into a single yet straightforward dashboard, highlighting the most important indicators from the average time to rent out a property to the early termination of rental contracts. This dashboard allows you to spot rental trends and gauge market appetite for properties within your portfolio.
Rental and Lettings KPI dashboard example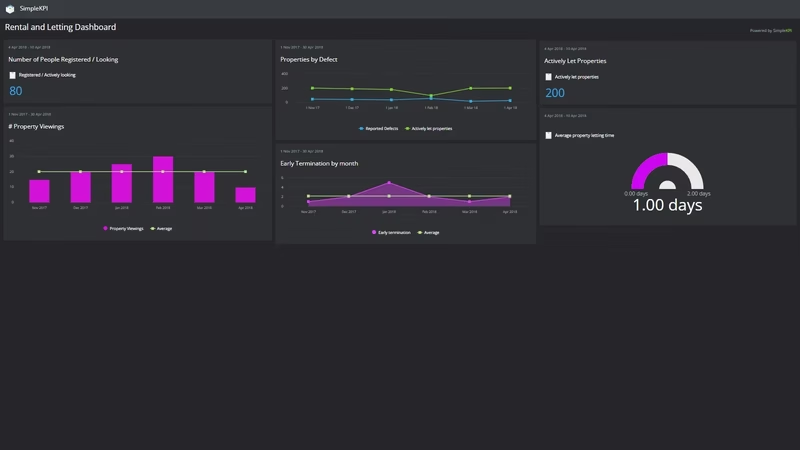
Restaurant KPI Dashboard
Restaurant KPI Dashboard offers a comprehensive tool for tracking vital restaurant metrics. Designed for owners, managers, and analysts, it addresses challenges in operational efficiency, customer experience, financial management, employee retention, and marketing effectiveness. The dashboard includes KPIs like Revenue, Average Customer Spend, Customer Satisfaction Score, Food Cost Percentage, Employee Turnover Rate, Table Turnover Rate, Online Orders Growth Rate, Marketing ROI, Inventory Turnover Ratio, Profit Margin, Customer Retention Rate, and Health Inspection Score, providing actionable insights for success.
Restaurant KPI dashboard example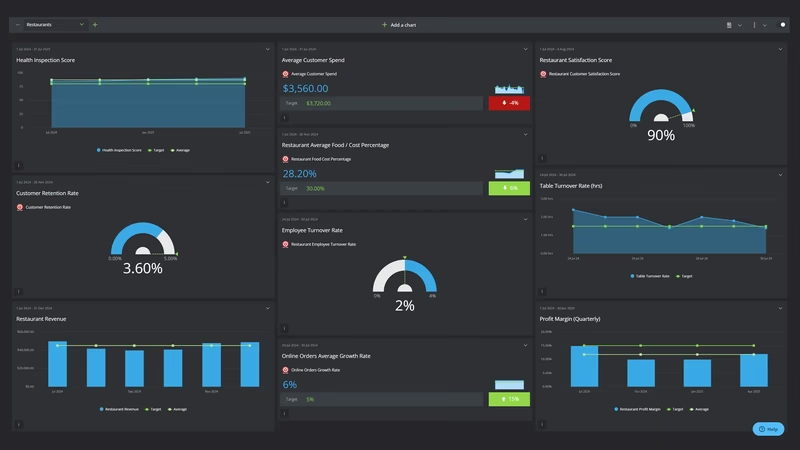
Retail KPI Dashboard
Retailers can benefit from insights into consumer behavior, seasonal variance, and inventory levels on a single dashboard. Knowing more about customers' buying habits can increase sales and customer satisfaction by tracking a series of specific KPIs.
Knowing your busy times and comparing them with previous periods can help with projections and growth forecasts. Stock and inventory gauges can assist with supply efficiencies and avoid embarrassing fulfillment issues.
Retail KPI dashboard example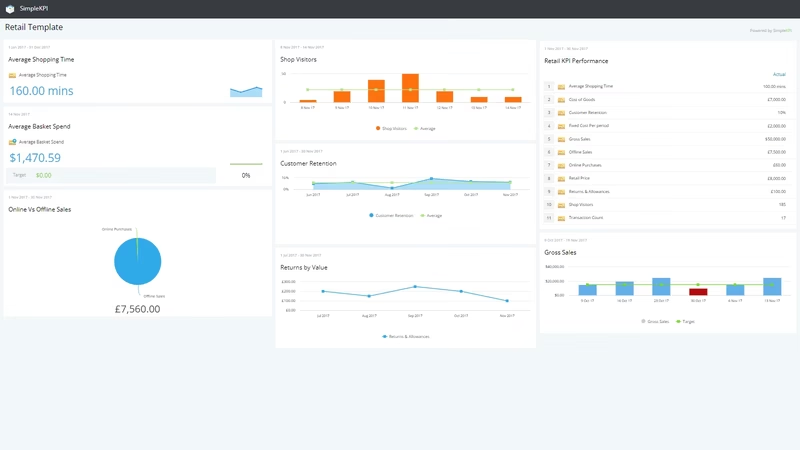
Retail Holiday Season KPI Dashboard
Optimize your holiday season performance with our comprehensive Retail KPI Dashboard. This dashboard is specifically designed to help retailers monitor crucial metrics such as sales performance, inventory management, customer experience, and operational efficiency. Track key indicators like Total Sales, Conversion Rate, and Stockout Rate in real-time to ensure a successful holiday season.
Retail Holiday Season KPI dashboard example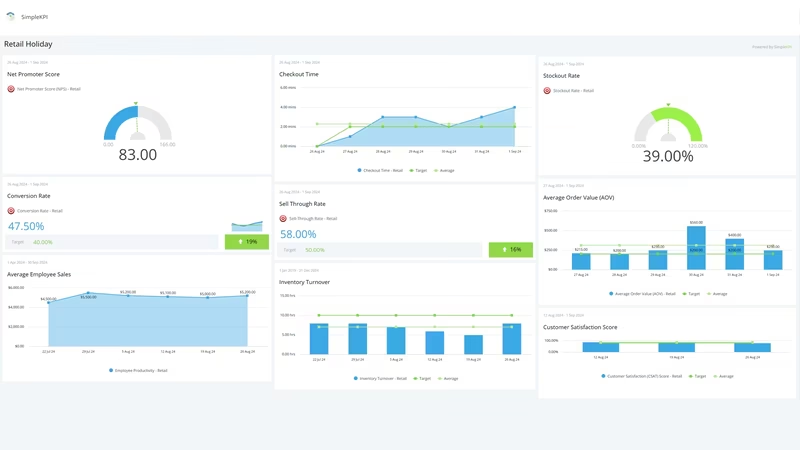
SaaS KPI Dashboard
In the world of Software as a Service, data generates at a fantastic pace. Keeping on top of this volume and filtering the measures into a use-able format can be a daunting task. SaaS focused graphs and charts can highlight the most critical metrics to tell a story of the customer journey. How many visitors, conversion percentages, and the all-important churn rate.
Having this information conveniently accessible via a KPI dashboard enables you to monitor the impact of even small changes that help convert prospects into loyal customers.
SaaS KPI dashboard example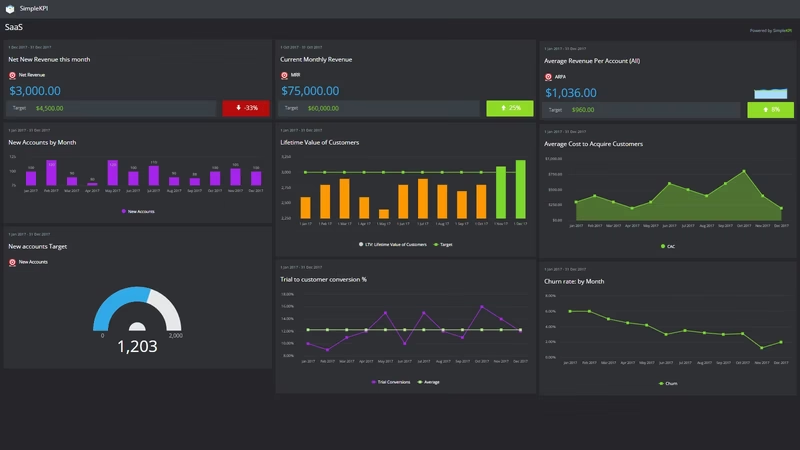
Sales KPI Dashboard
This sales dashboard looks at the different sales metrics and KPIs across an organization. For example, Sales leaders need to have performance information available at-a-glance; they need to see the status of leads and opportunities and have real-time answers to questions like; are teams or individuals achieving their goals? Are those opportunities turning into sales?
Motivating teams and individuals by openly displaying a sales leader board on any monitor or device is a great way to automate performance.
Sales KPI dashboard example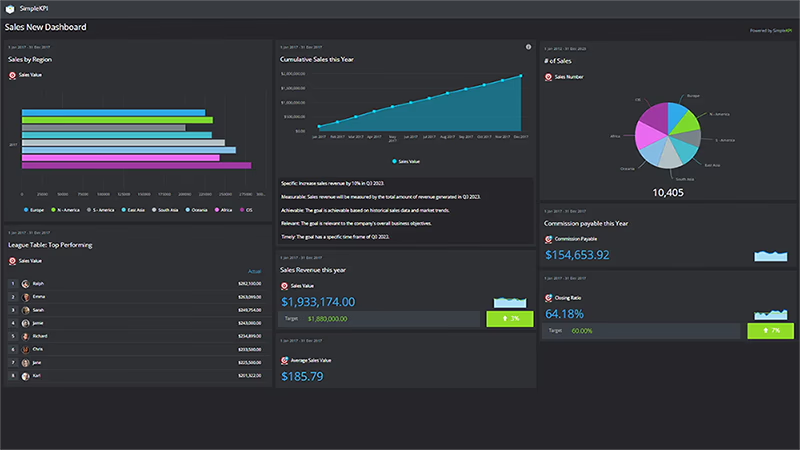
Security Firm KPI Dashboard
Security Firm Dashboards can help firms get to grips on their performance, streamline workflow and better communicate with clients and governance. Understanding everything from the number and type of incidents to the worker injuries by location or contract can offer insights that fuel performance initiatives.
Clients can see in precise and transparent dashboards how services and contracts are provided - without having to painstakingly pull data from a variety of sources to create reports.
Security Firm KPI dashboard example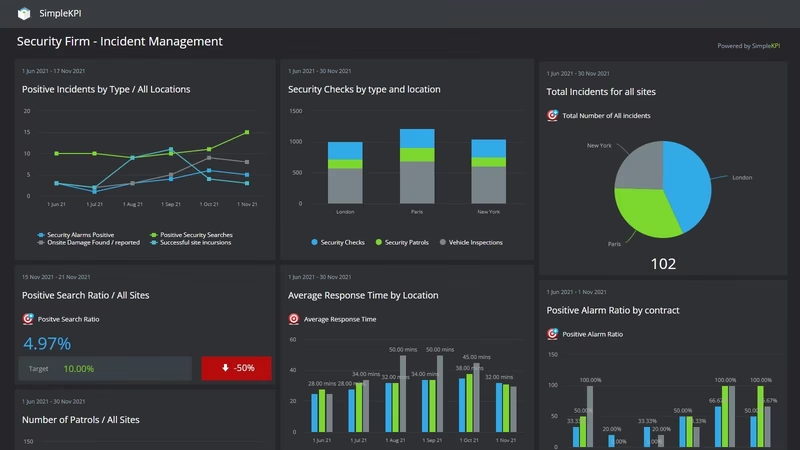
Startup KPI Dashboard
Monitor your startup's growth and success with our comprehensive Startup KPI Dashboard. Designed to track critical metrics like customer acquisition cost (CAC), revenue growth, churn rate, and burn rate, this dashboard is your key to making data-driven decisions and securing your startup's future.
Startup KPI dashboard example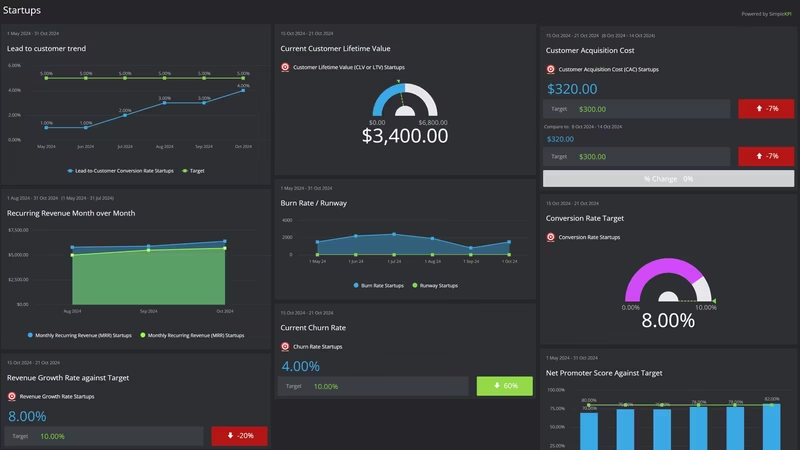
Supply Chain KPI Dashboard
This dashboard serves as a centralized hub for tracking critical supply chain metrics. It aggregates inventory levels, order fulfillment rates, lead times, and transportation efficiency data. The dashboard facilitates cross-functional collaboration. Supply chain managers, procurement teams, and logistics experts can make informed decisions based on real-time data.
Supply Chain KPI dashboard example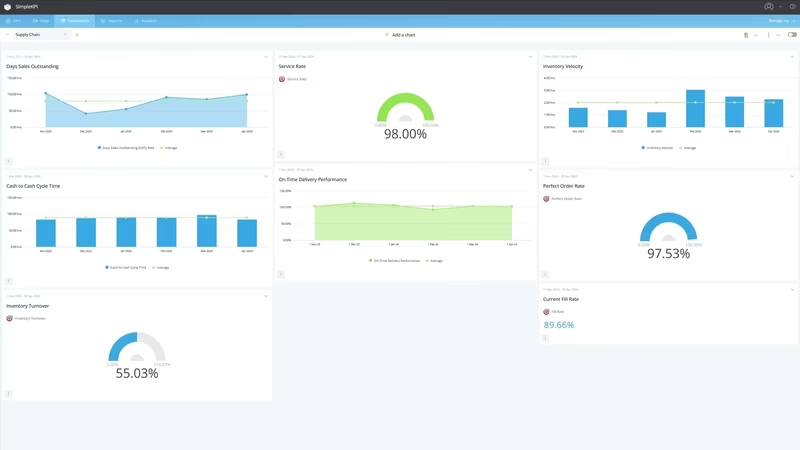
Theme Park Guest Experience KPI Dashboard
Monitor live ride queues, guest sentiment, and spending behavior in one place. This Theme Park Guest Experience Dashboard helps park operators orchestrate smoother, happier, and more profitable days.
Theme Park Guest Experience KPI dashboard example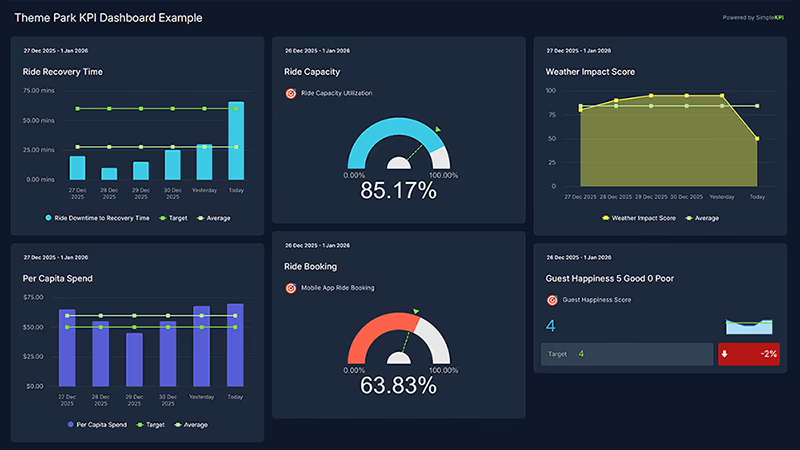
Veterinary Clinic KPI Dashboard
Veterinary clinics face unique challenges like seasonal pet health demands, inventory spoilage risks, and balancing compassionate care with profitability. A KPI dashboard centralizes critical metrics such as appointment volumes, revenue per transaction, and staff efficiency to spot issues early and drive data-backed decisions.
Veterinary Clinic KPI dashboard example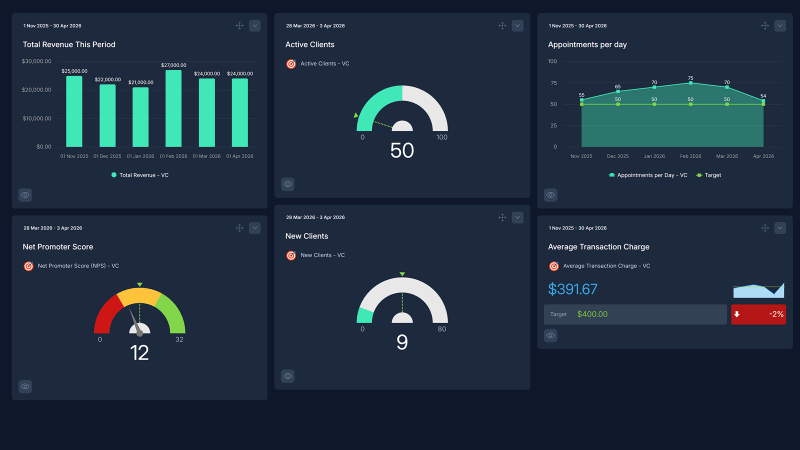
Waste Center KPI Dashboard
In today's environmentally conscious business landscape, companies are increasingly held accountable for their ecological footprint. Waste centers equally need to contribute to the efficiency of product recycling. This waste center example dashboard incorporates metrics such as Waste Generation Rate, Recycling Rate, Waste Disposal Costs, and Waste Diversion Rate and serves as an essential tool for centers aiming to improve their waste management practices and sustainability efforts.
Waste Center KPI dashboard example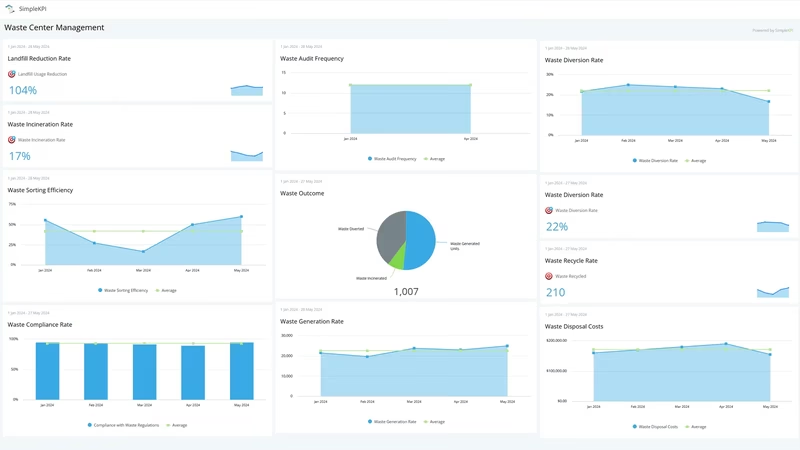
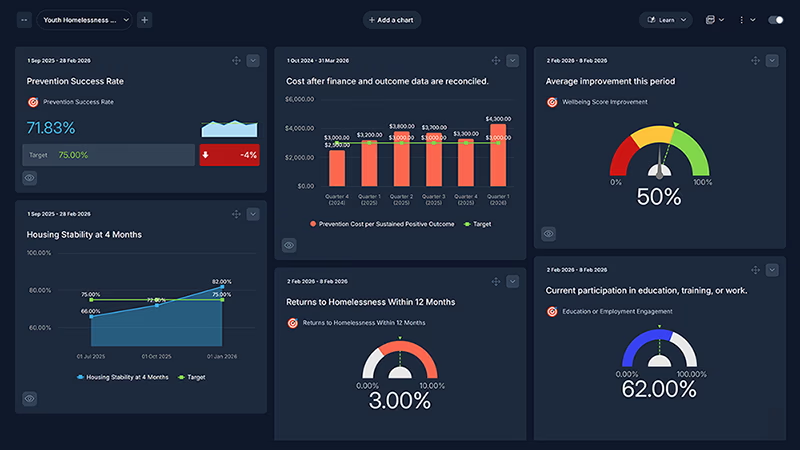
Youth Homelessness Prevention Outcomes KPI Dashboard
Track prevention success, housing stability, and life outcomes in one place. This Youth Homelessness Prevention Dashboard helps charities and local authorities show what’s working, who is being left behind, and where to focus next.
Youth Homelessness Prevention Outcomes KPI dashboard example