What is a Public Sector KPI Dashboard?
A public sector KPI dashboard is a tool that helps government officials track and measure their organization's performance against specific goals and objectives. The charts, graphs, and gauges use quantifiable measurements that help determine the strategic, financial, and operational achievements. These public sector KPIs measure the effectiveness of everyone within the local government, from individual employees to the county or municipality as a whole.
KPIs are vital for local governments to maximize their budgets for the benefit of their communities. When KPIs are defined and measured effectively, it allows data-based decisions to be made - that lead to actionable improvements in the community. In turn, constituent satisfaction can be gauged, and clear indications as to future funding and efforts can be made.
With limited budgets coupled with high standards for performance, the KPIs on the dashboard are a way for local governments to get the most out of their limited funds and improve efficiency across the board.
KPIs are also essential for local governments to showcase their successes. It is vital for communicating the benefits and work undertaken by the public services for the citizens, improving satisfaction rates and community morale.
Who is this dashboard for?
Government officials use public sector KPI dashboards to monitor and evaluate the performance of their authority. They track progress toward specific goals and objectives and identify areas where improvements can be made. A variety of job roles, including elected officials, department heads, and other government employees use these dashboards. By using a public sector KPI dashboard, government officials can make data-driven decisions, improve efficiency, and ensure that they are meeting the needs of their constituents.
What problems is this template trying to address?
Public sector KPI dashboards aim to solve various problems local governments face.
These can range from the community's perception that their taxes are being used in the wrong places and managing funding more efficiently, to using the KPIs to find opportunities to improve the community's standard of living.
Additional issues this dashboard is aiming to address:
- Showcasing their successes.
- Making actionable improvements in the community.
- Gauging constituent satisfaction.
- Dictating where future funding and efforts should be prioritized.
- Improving efficiency across the board.
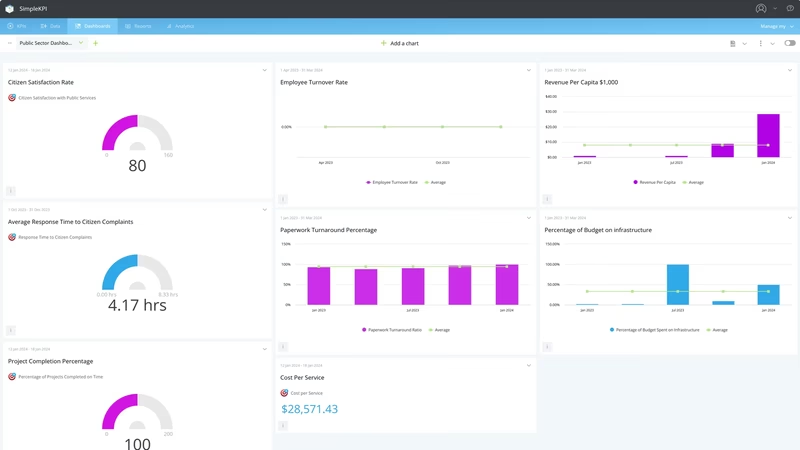
What's in this dashboard?
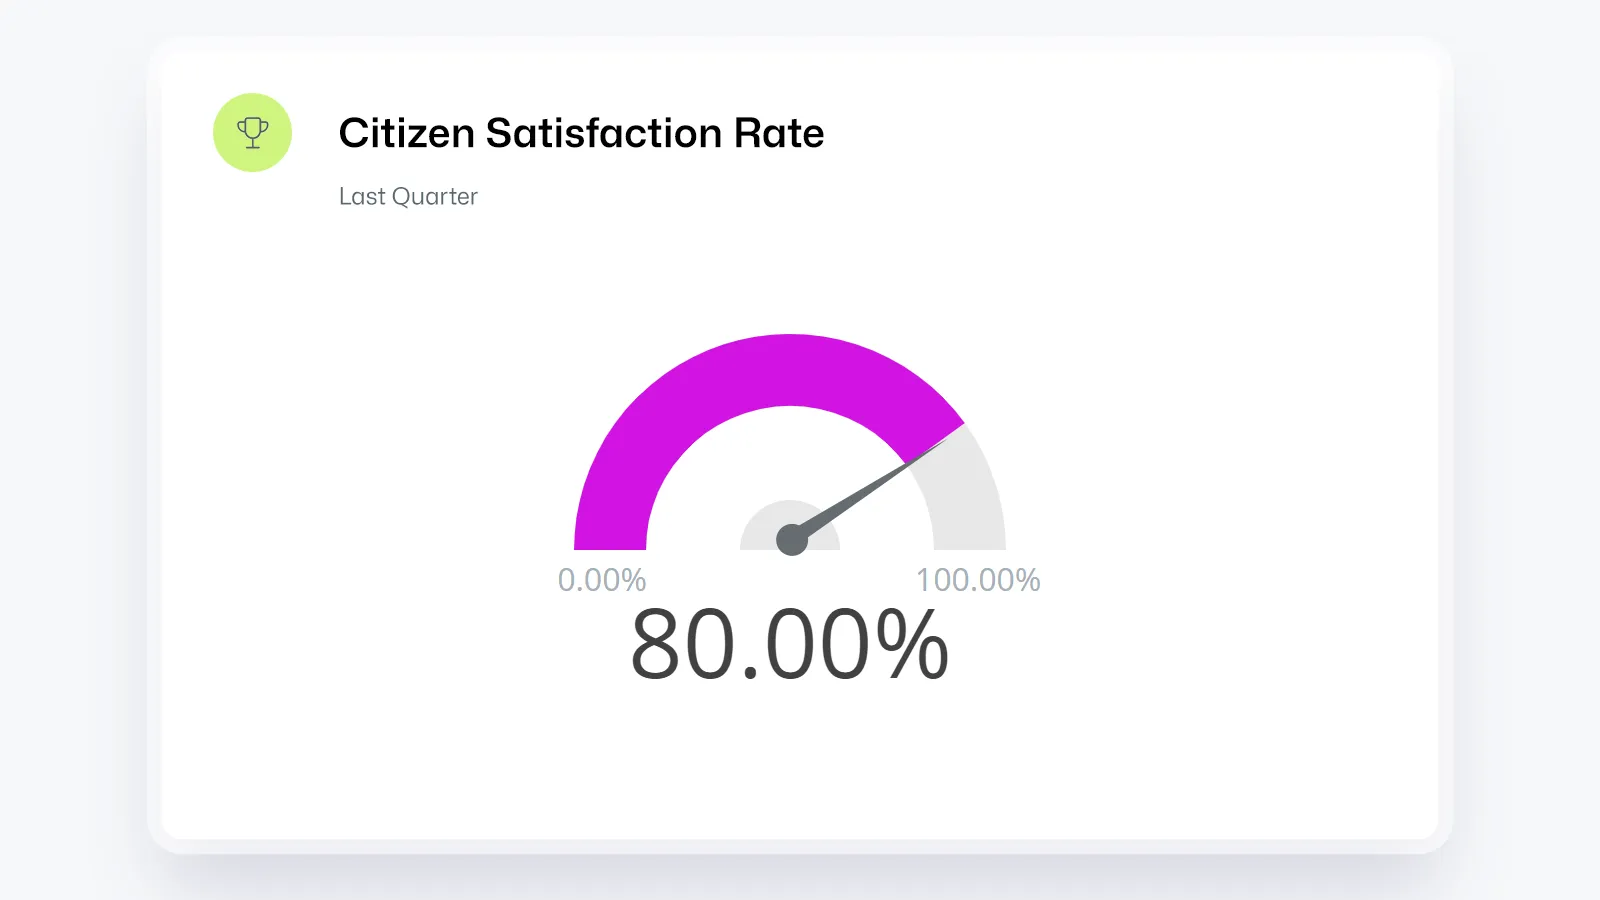
Some of the 9 KPIs that are contained within a public sector KPI dashboard include turnaround times for getting paperwork approved, percentage of budget spent on infrastructure, citizen satisfaction with public services, employee turnover rate, cost per service, revenue per capita, response time to citizen complaints, and percentage of projects completed on time. These KPIs are vital for local governments to manage and improve public services.