SIMPLICITY
Easy to learn. A breeze to setup.
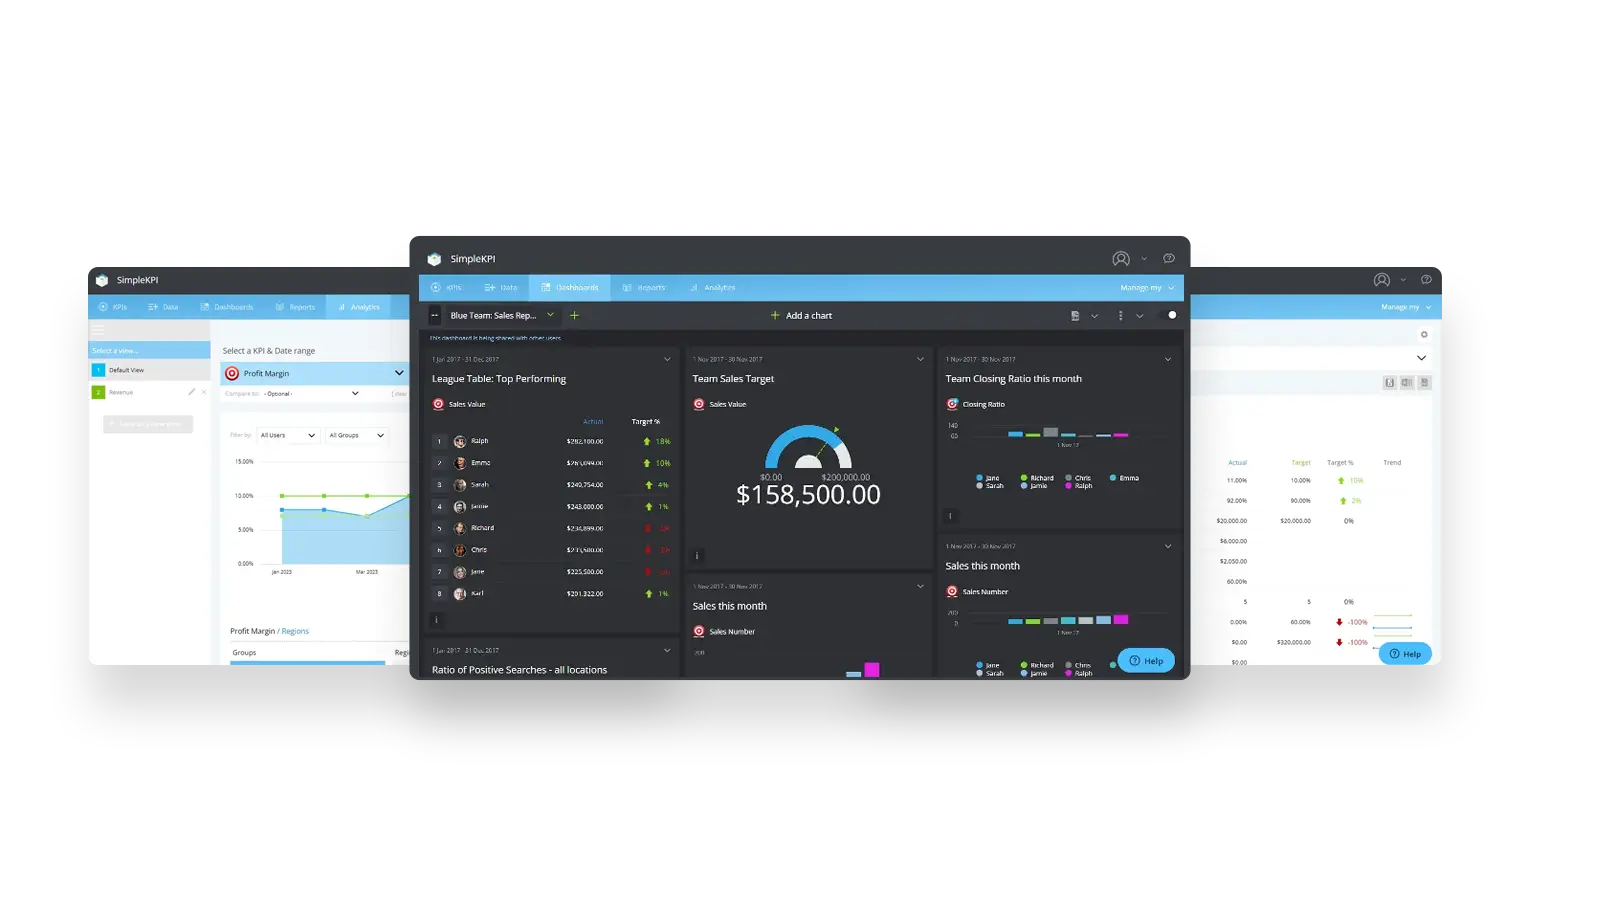
The complete
KPI Software tool
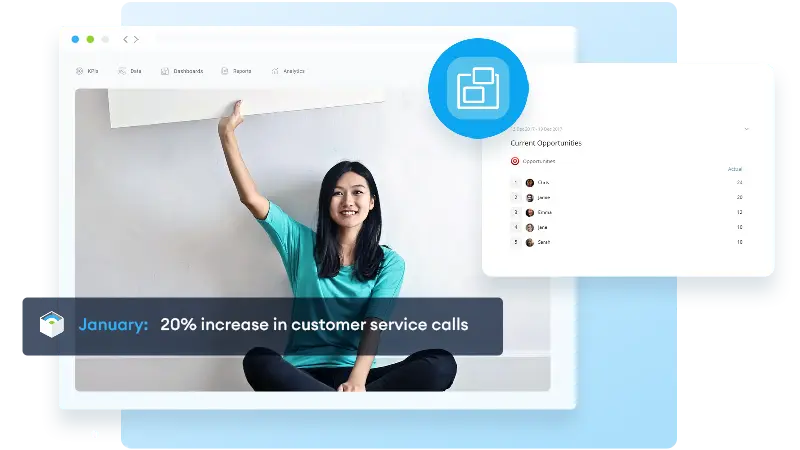
Create your own KPIs or use ready-made templates, connect your data sources and monitor the performance of individuals, teams or the whole organization on KPI Dashboards and Reports. Then explore the data to discover insights and opportunities with KPI analytics and tracking tools all seamlessly from one place.
Explore these integrated features:
KPI Dashboards KPI Reports KPI Analytics KPI Tracking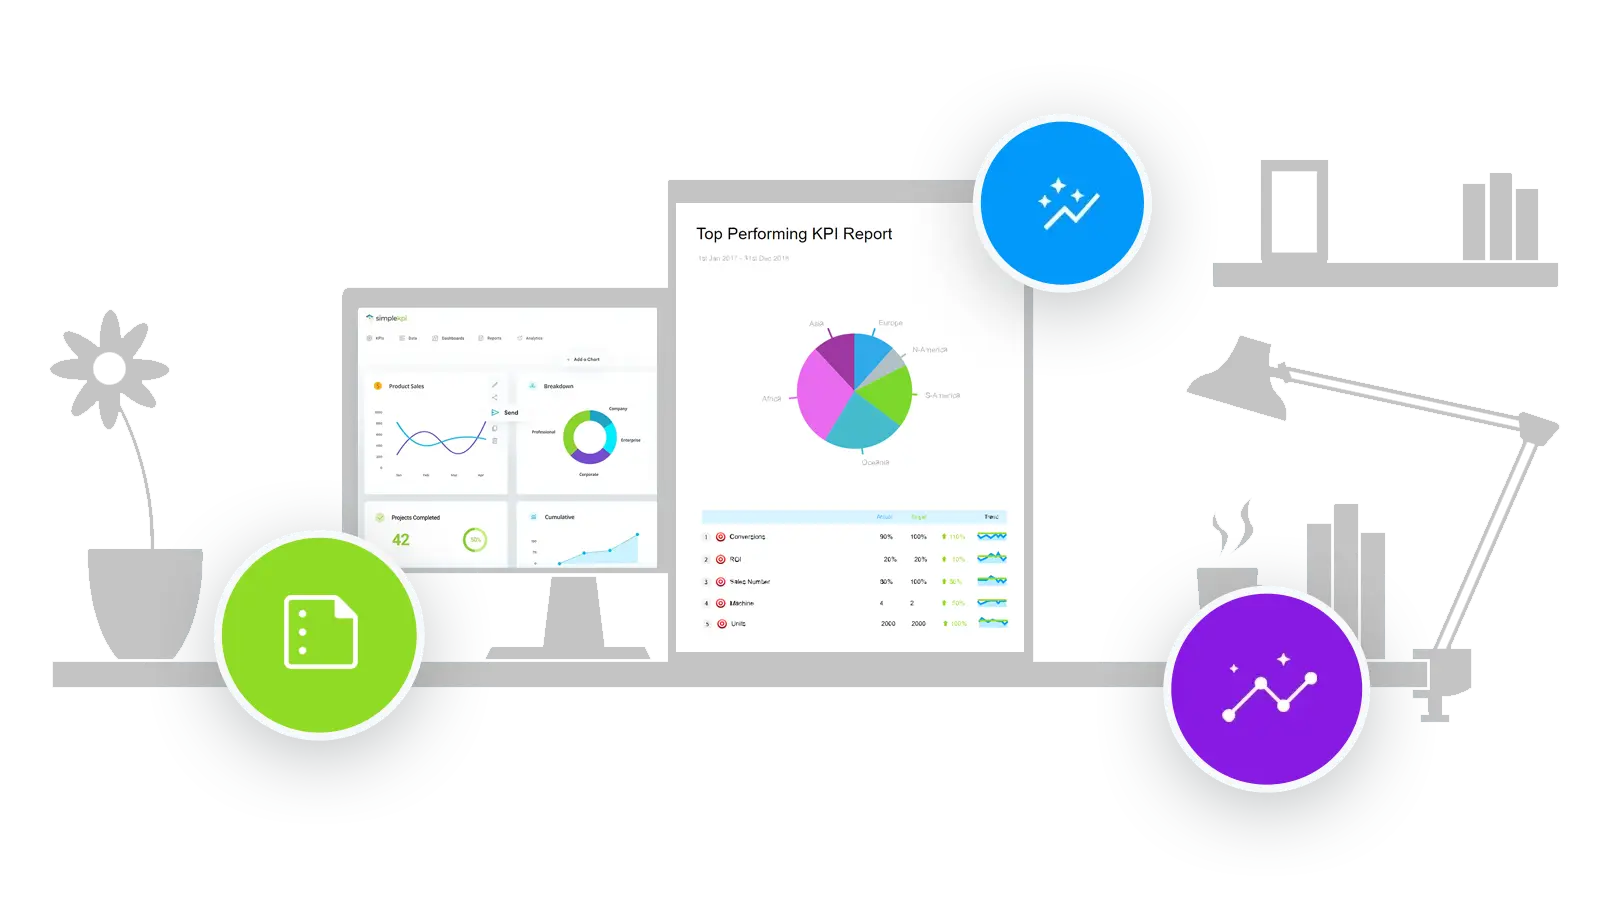
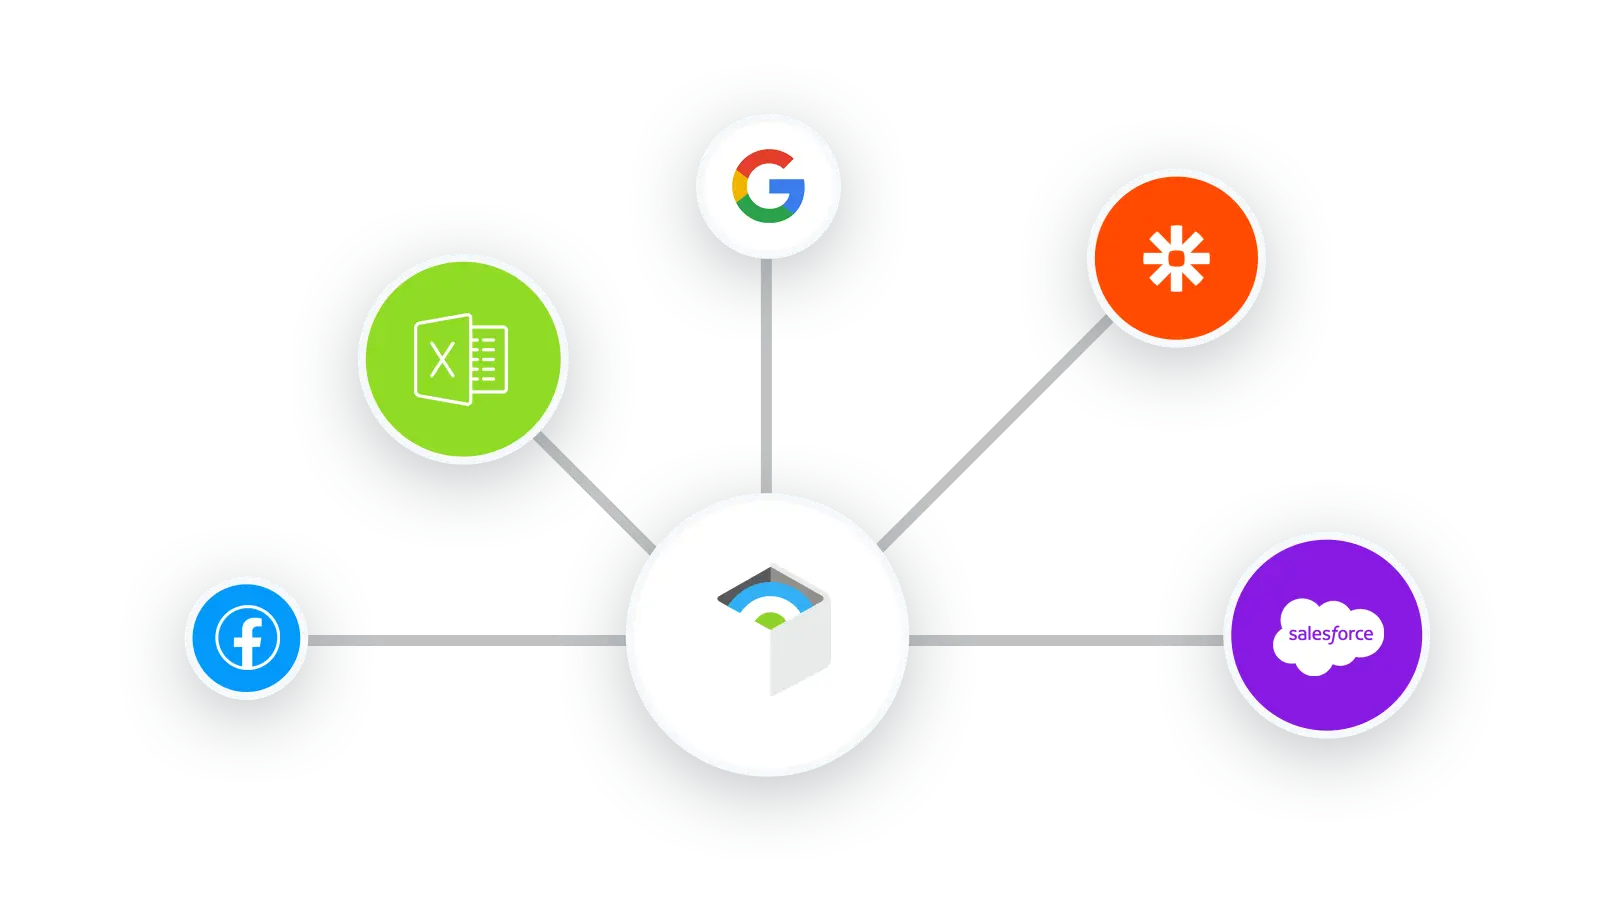
Integrate your data from anywhere
Bring your data into SimpleKPI from over 5000+ business applications, including spreadsheets, databases and all the most popular business applications.
Start integrating your dataTrack KPI goals and monitor targets
Set your performance goals and track targets across your organization. Monitor the progress at individual, team and company levels.
Start tracking your KPI Targets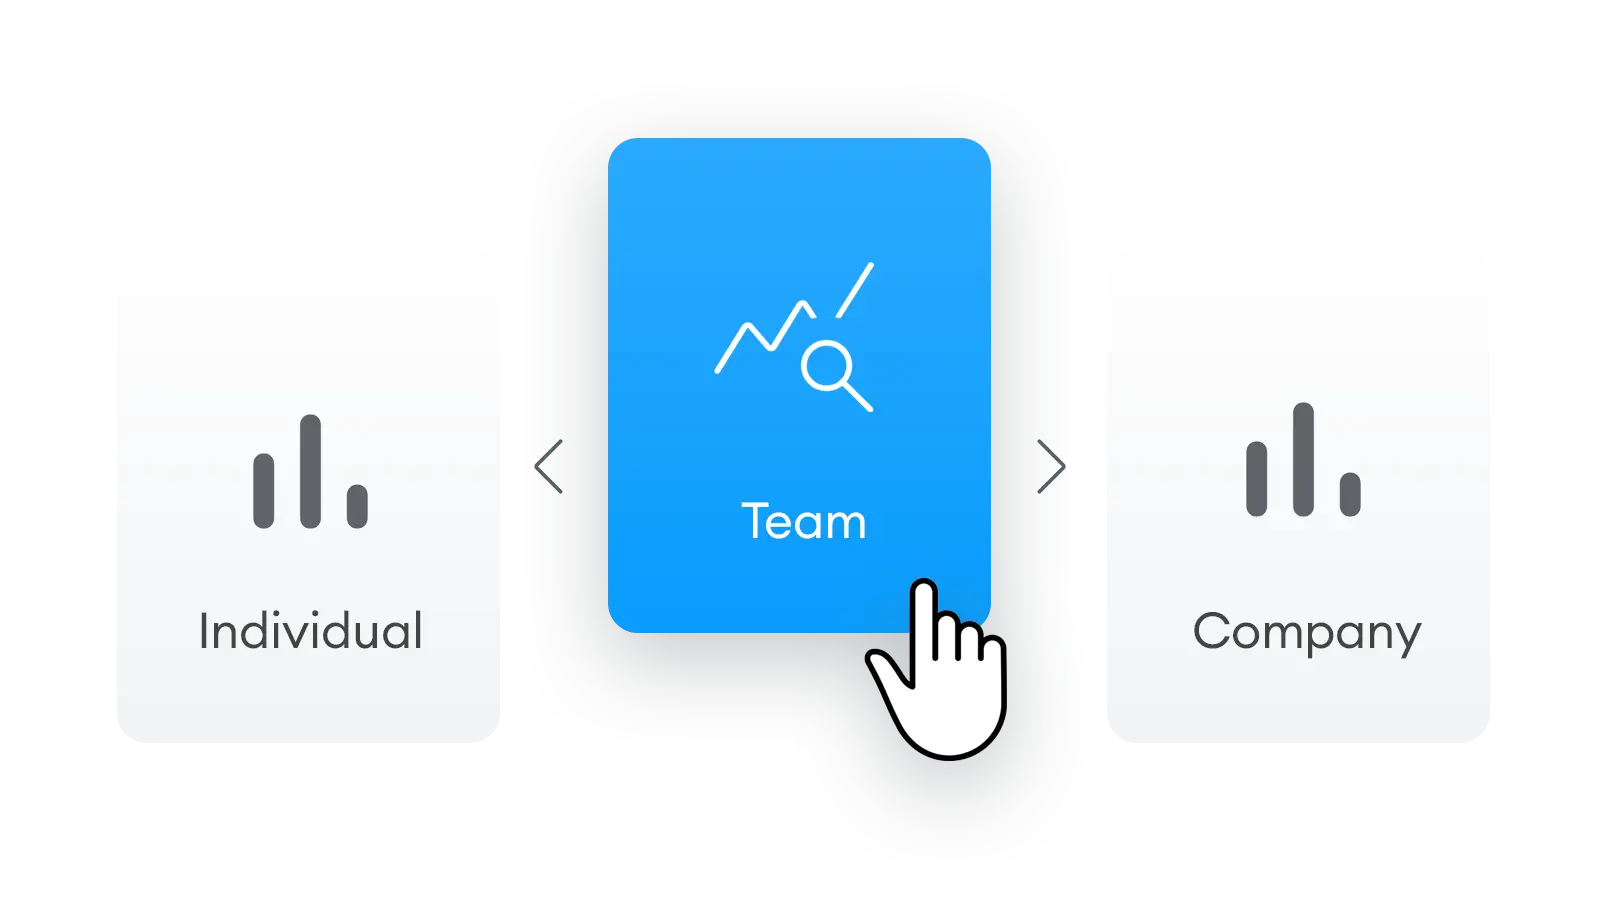

One incredibly simple pricing model
A one price, unlimited subscription pricing model means your subscription stays the same as you grow. Complete freedom to have as many users, dashboards, reports and KPIs as you need.
Learn more about pricingSimple, intuitive design
SimpleKPI has a clear and consistent layout, minimal design and a user-friendly layout. Its logical and natural navigation system enables users to navigate with ease. This approach to tracking KPIs increases user satisfaction and productivity - with less time learning and more time uncovering insights.

Calculated KPIs
Create formulas to perform automated calculations from your KPIs.

KPI Library
Create your own KPIs or take advantage of the extensive KPI library.

Collaborate
Collaborate and communicate your performance with colleagues more effectively.

Unlimited Users
Benefit from hassle free user management, everyone's included.

KPI templates
Choose from any of our predefined industry standard KPI templates

Share Dashboards
Build insightful KPI Dashboards and share with colleagues or make them available to everyone.

24/7 Support
Comprehensive 24 hr Online support for peace of mind.

Full Screen Mode
Present your dashboards in full screen mode on monitors or TVs.

Export
Export your dashboards, reports and data in PDF and Excel formats.

Customize
Easily customize the SimpleKPI interface with your corporate colors and branding.

Integrate
Use the API, spreadsheets or connectors to bring data into your SimpleKPI account.

Embedding
Embed individual, charts graphs and reports into your own website or intranet.