All the KPI Tools you need, all in one place.
KPI Dashboards
Quickly bring your data to life with interactive charts and graphs.
KPI Reports
Create and share meaningful insights with teams and colleagues.

KPI Analytics
Analyze the ups and downs to make sense of your data.
KPI software for all
Performance management doesn't have to be complex. With SimpleKPI, you get all the tools you need to monitor and visualize your business metrics effortlessly. Packed with user-friendly features, it streamlines understanding your business performance, saving you valuable time.
- See your business KPIs at a glance with interactive dashboards.
- Share your reports with your team using collaboration tools.
- Dive deeper into your data with our analysis features.
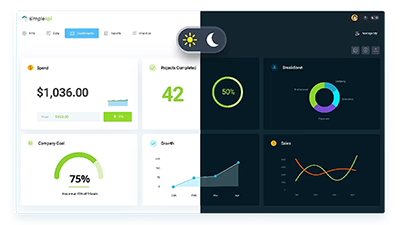
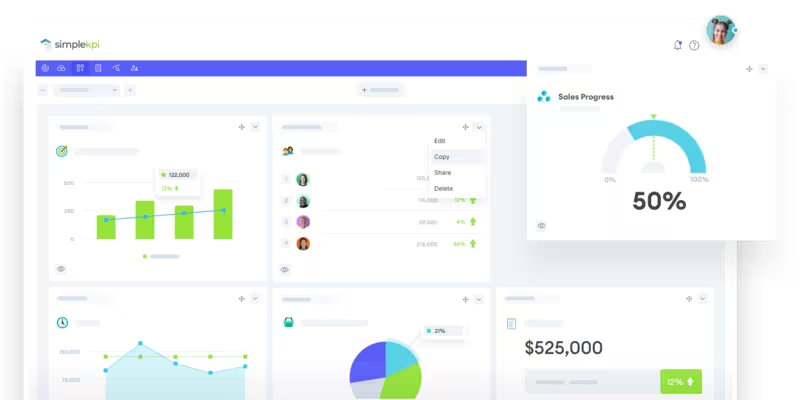
KPI Dashboards that propel performance
A simple, easy-to-use dashboard that takes complex data and turns it into accessible and understandable visuals.
Create top-level summaries of your KPIs to share across your organization. Choose from charts, graphs, league tables, and widgets that help communicate an accurate understanding of your data.
- Real-time monitoring
- Use customizable Dashboard Examples to get started
- Share and collaborate
- Turn Excel Spreadsheets into Dashboards
- View your data from a wealth of perspectives
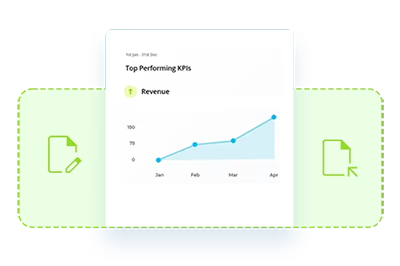
Robust KPI Reports for companies, departments, and teams of all sizes
Get summary and detailed information that provides a complete picture of your progress toward targets and goals.
And what's more – your KPI Reports can be generated and exported in various popular formats such as PDF, Word, or Excel.
Build engaging KPI Reports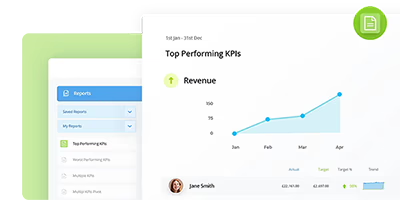
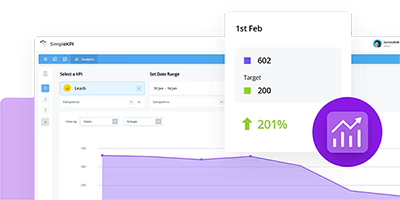
Delve into your data
with KPI Analytics
See what's making up the numbers. Compare trends over different periods and determine the root cause of any peaks and troughs.
- Use drill-down and up features to see data at all levels
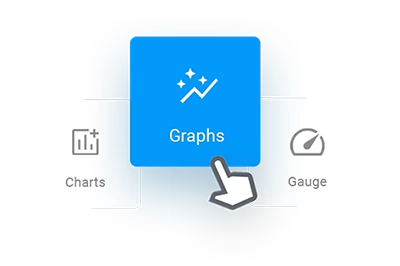
- View your data from a wealth of perspectives using various graph types
- Discover opportunities hidden within your data
- Share reports and export in PDFs and Excel formats
Stay on course with
KPI Tracking
Follow your performance every step of the way. Track your KPI data across different periods to ensure targets get met.
Tracking KPIs couldn't be easier. Simple, intuitive features make setting up and tracking various performance management initiatives easy.
Get KPI TrackingKPI Dashboard Examples
Get inspired with our range of industry-generated KPI Dashboard Examples. Choose which KPIs are relevant for you and customize the dashboards to your heart's content.
Explore KPI Dashboard Examples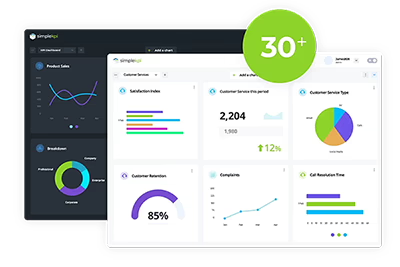
KPI software measures business performance across organizational areas such as marketing, sales, operations, and finance. It allows for consolidating data from diverse sources and visualizing this information on KPI Dashboards and Reports. This software provides businesses with analytics tools to gain insights into their performance and to make data-driven decisions.
A KPI dashboard presents key performance indicators using interactive charts and graphs, streamlining the review and analysis process. These dashboards serve as an effective tool to disseminate performance data and insights throughout an organization, promoting efficiency and informed decision-making.
A KPI report serves as a valuable performance reporting tool for businesses. It enables a quick and comprehensive review and analysis of Key Performance Indicators (KPIs). These reports provide real-time insights in a logical and easily understandable format, allowing organizations to effectively track their performance against specific goals.
KPI Analysis involves analyzing the underlying data and metrics used to create Key Performance Indicators (KPIs). This helps businesses identify opportunities, address issues, and gain insights through visual representations like graphs and charts. Data analysts and senior managers use analytics to extract insights, streamline processes, and uncover growth opportunities.