What is a SaaS dashboard
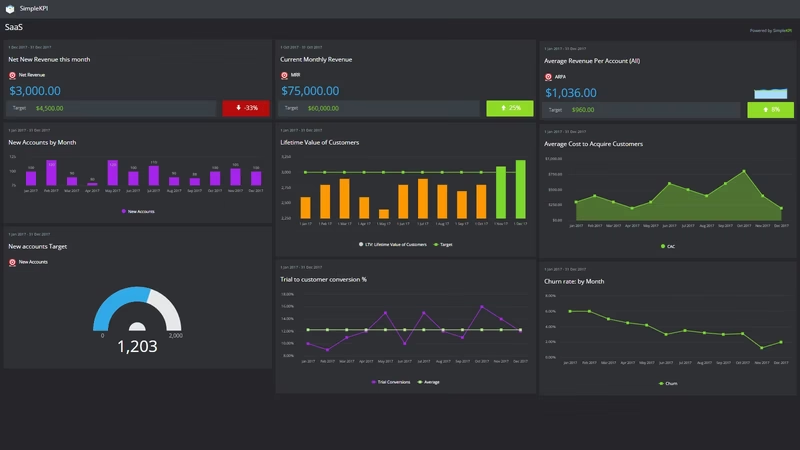
A SaaS dashboard is a monitoring and data collation tool that brings together Key Performance Indicators and Metrics directly related to online software distribution. They combine the many different data sources needed to monitor the entire process of on-boarding and retaining customers. This data can then be turned into a more understandable and usable form, usually in the form of widgets, charts, graphs, gauges and lists.
The challenges facing SaaS providers
SaaS organizations face a considerable challenge retaining customers, with an average annual churn rate hovering around 5.2%. Ensuring that businesses are delivering continued value to their customers is vital to their survival and sustainable growth.
High CAC and long sales cycles put additional pressure on how profitable a business can be. Many are seeing a 180% increase in CAC and a 150% longer CAC payback period, which demonstrates that it's become increasingly harder and expensive to close new customers.
Operational inefficiencies also persist, with 64% of organizations reporting that limitations in automation and visibility hinder efficiency gains, and half of enterprises wasting at least 10% of their software budgets due to underutilized or unmanaged resources. Addressing these issues via KPI tracking is essential for SaaS businesses to thrive in an increasingly competitive and complex market.
Who is this dashboard for?
This dashboard was designed to accommodate the ever-expanding needs of owners and operators of SaaS businesses. Especially those involved in Software as a Service for the first time, or start-ups wanting to finesse their initial processes to maximize conversion rates.
Overview
Although Software as a Service business models are generally more complex than traditional businesses, they do benefit from having more, and directly sourced data that is easier to monitor and automate. These metrics can be used to track and improve the entire process needed to find and acquire customers, such as the number of visitors to the website and then those visitors that are converted to paid customers.
These dashboards may also be split into at least three separate areas that may focus on:
- Acquiring potential customers or driving web traffic through marketing initiatives via social media channels, PPC, email marketing and partner channels.
- Onboarding customers by tracking the steps and interactions the user takes on their journey to setting up and using the software.
- Retaining Customers by monitoring behavior and trends that highlight customers not fully engaged with the application, in addition to tracking support queries and feedback needed to improve the software.
These dashboards also provide instant feedback on the performance of new features and changes to the application as they are implemented.