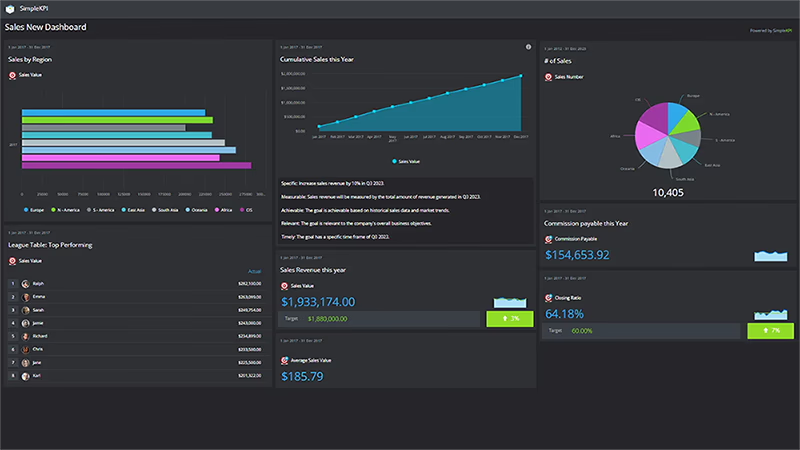
What is a Sales Dashboard?
A Sales dashboard is a performance tracking tool that is focused on visualizing sales related Key Performance Indicators, Metrics and measures. They are used by both managers and executives to visualize direct performance against targets and goals in a series of graphs and league tables. They are also utilized by business owners and stakeholders to see how efficiently revenue generation is being conducted across the organization.
Who is this dashboard for?
This dashboard was designed to cover a broad spectrum of sales orientated KPIs. It can be best used for promoting and communicating individual, inter team or department performance and provides a single point of monitoring for managers and senior company executives.
Overview
Sales is a dynamic and energetic function of any business model. The business landscape is constantly shifting and trends, tactics and knowledge changes almost as quickly. Keeping on top of this fast-paced environment can be challenging. Dashboards offer a convenient way to track the various functions and activities within a sales environment. From generating leads through calls and monitoring prospects all the way through to the volume of closed sales, the entire pipeline can provide valuable information to help make generating revenue more efficient.
Sales dashboards can fall into the following categories:
- Sales activities can detail all the ground work needed for success such as, calls, appointments and meetings. These activities can be linked to sales to provide conversion statistics.
- Stage and pipelines can sort and detail both the stages of the sales process and the potential revenue value, particularly useful for forecasting.
- Leader boards and individual Performance can be used as a motivation and incentive tool for both teams and individuals. These dashboards can provide an at-a-glance position of actual revenue against target and volume of sales.
