What is an E-Commerce Dashboard?
An E-commerce dashboard is a tracking and visualization tool focused on measuring KPIs and Metrics associated with the process of marketing and selling of goods and services online. Data generated from E-commerce transactions is predominately digital in nature, which allows for it to be consumed into graphs and charts for easier than other business models.
Who is this dashboard for?
This dashboard can be used by all types of users who sell goods or services online. From established web orientated businesses looking to track KPIs to set strategic goals through to individuals just starting out in the world of e-commerce.
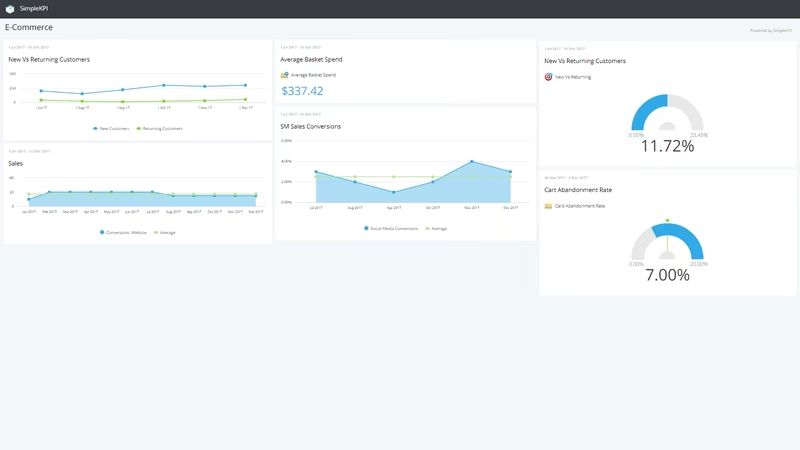
Overview
E-Commerce covers the complete spectrum of buying and selling online for both small and large enterprises alike. It brings many different technologies and disciplines together, such as card processing, shopping platforms, online marketing, inventory management, CRM systems and tracking applications. All these technologies and practices generate large amounts of data, which provides a great opportunity to use the insights provided by visualizing this data in charts and graphs.
Dashboards also offer a great starting point for creating an e-commerce strategy that incorporates all the activities, media channels and the additional service and tools you will need to increase your online sales.