What is a Customer Service Dashboard?
A Customer Service dashboard assists in monitoring a company’s service levels, customer satisfaction and the overall performance of the department. Relevant Key Performance Indicators and Metrics are used to display graphs and charts, usually focusing on trend and SLA’s. These are subsequently used to create more efficient practices when dealing with a customer’s issues, problems and questions.
Who is this dashboard for?
This dashboard is designed to be used Customer Service managers and executives whose responsibilities include managing customers’ expectations and resolving any problems during their different stages of interactions with a business.
Overview
Customer service is an integral part of nearly every business. Its continuing importance is elevated by the constant expansion of channels in which interactions occur - driven predominately by social media.
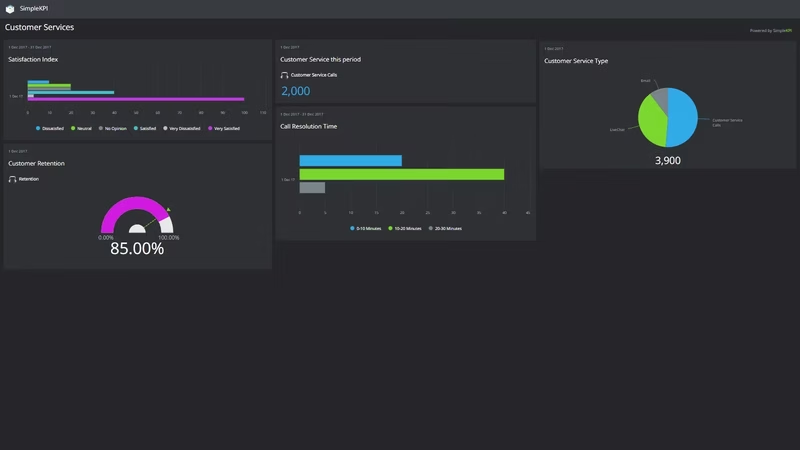
Ensuring that customers issues, complaints and information requests are dealt with promptly and efficiently is the core focus of this example dashboard. It encourages monitoring of KPIs such as Call resolution Time, the type of customer service and the retention rate.
The customer satisfaction index has become a prominent part of measuring the Customer Service success of a business, this index provides an easy to understand scale of how customers interactions are viewed in a simple rating format. Normally this rating may contain a scale from 1-5 or very satisfied to dissatisfied.