What is a Coffee Shop KPI Dashboard?
A Coffee Shop KPI Dashboard is a management tool used to track Key Performance Indicators (KPIs) used in operating Coffee Shops. Typically, KPIs will cover Resources, Revenue, and Customer Service.
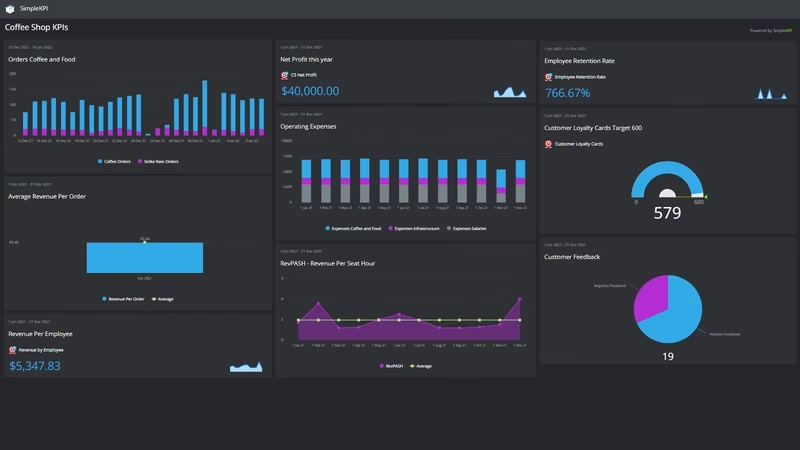
The data used to create these KPIs is translated into Graphs and Charts that help owners understand trends and issues more quickly than viewing raw data alone.
Overview
A targeted Coffee shop dashboard offers smaller companies access to performance tracking once reserved for larger organizations. With information about their business provided in easy-to-understand charts and graphs, owners can monitor and plan for their business backed up by data.
This dashboard looks at the three core elements of a coffee shop business.
-
The Resources
By monitoring the relationship between staffing levels, customer satisfaction, and employee retention, owners can decide on resources, training plans, and service levels.
-
Revenue
Managing operating expenses for smaller firms is a critical factor affecting their competitiveness. Tracking KPIs such as Net Profit, Revenue and Revenue er Employee is vital to ensure an advantage.
-
Customer Service
Nothing kills off a Coffee Shop faster than poor customer service. Keeping a close eye on customer feedback and loyalty schemes is now standard.
Who benefits from this dashboard?
The great thing about Coffee Shop KPI Dashboards is that, unlike large organizations, all the core aspects of the business can be viewed at the same time.
Once, an owner would need to check various systems (sometimes paper-based) and collate this information into a complete picture of their business. Now, most of the data can be pulled in automatically from POS and Feedback systems.
Owners can now quickly see revenue fluctuations that may need addressing. Providing valuable insights, for example, at what times of the year it may be more profitable to hire temporary staff.
Forecasting stock levels can also be managed using dashboards. For example, if the dashboard trend-charts confirm that certain seasons of the year amount to more coffee sales.