Innovation Management Dashboard for Tracking Progress and Success
The Innovation Management Dashboard provides a centralized, visual hub for tracking the effectiveness of your company's innovation initiatives and R&D efforts. It consolidates key performance indicators (KPIs) related to ideation, development pipeline, resource allocation, and the commercial impact of innovation, transforming complex data into actionable insights. This dashboard empowers leaders and teams to make informed decisions, optimize processes, and align innovation efforts with strategic business goals.
Challenges Faced in Corporate Innovation
Many organizations struggle to effectively manage and measure innovation, facing significant hurdles that can stifle progress and competitiveness. Common challenges include:
- Lack of Strategic Alignment: Innovation efforts often lack clear objectives or fail to connect with the overall business strategy, leading to scattered initiatives with limited impact.
- Insufficient Resources: Inadequate budget, time, or skilled personnel dedicated to innovation hinders the development and implementation of new ideas.
- Cultural Resistance: Fear of change, risk aversion, and a culture that doesn't encourage experimentation or tolerate failure can prevent novel ideas from flourishing.
- Ineffective Processes: Poor idea management systems result in valuable concepts getting lost, while bureaucracy and internal politics can block progress.
- Difficulty Measuring Value: Without clear metrics, it's hard to evaluate the effectiveness of innovation programs, justify investment, or demonstrate ROI[3].
- Innovation Silos: Lack of cross-functional collaboration prevents the sharing of ideas and diverse perspectives, limiting innovation potential.
How This Dashboard Helps Overcome Challenges
This Innovation Management Dashboard is designed to address these common obstacles directly:
- Provides Clarity and Focus: By visualizing key metrics against targets, it ensures innovation efforts align with strategic goals and progress is clearly tracked.
- Optimizes Resource Allocation: Tracking KPIs like R&D spending and ROI helps justify budgets and allocate resources to the most promising initiatives efficiently.
- Enhances Pipeline Management: Visualizing the idea funnel and conversion rates highlights bottlenecks and improves the process from ideation to launch.
- Fosters an Innovation Culture: Measuring employee participation demonstrates commitment and can help identify areas where engagement needs encouragement.
- Enables Data-Driven Decisions: It offers a single source of truth, consolidating data to support objective evaluation, identify trends, and refine innovation strategies[3][5].
- Improves Accountability & Communication: Shared visibility into performance enhances collaboration and keeps stakeholders informed about innovation outcomes[3][5].
Breakdown of Key Innovation KPIs
This dashboard tracks crucial metrics to provide a comprehensive view of your innovation performance:
-
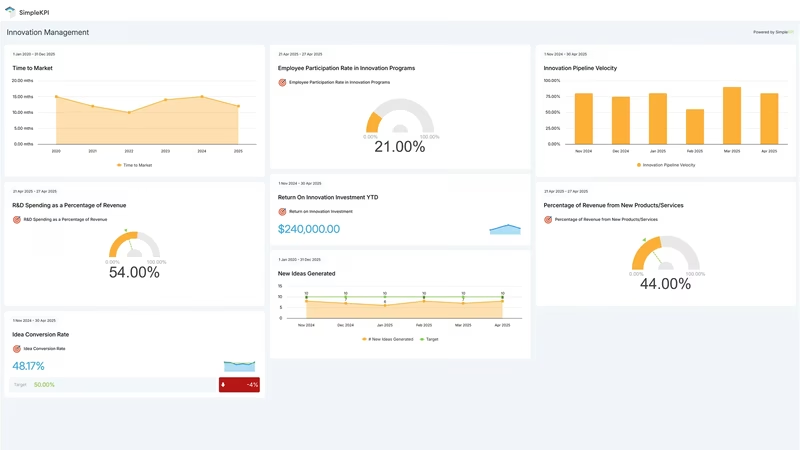
Number of New Ideas Generated
What it does: Measures the total volume of unique ideas submitted into the innovation pipeline during a specific period.
Benefits: Indicates the level of creative input and ideation activity within the organization; gauges the health of the front end of the innovation funnel.
Calculation:Count of unique ideas submitted (per month/quarter/year) -
Idea Conversion Rate
What it does: Calculates the percentage of submitted ideas that successfully progress through the pipeline and are implemented (as products, services, process improvements, etc.).
Benefits: Assesses the efficiency and effectiveness of the innovation pipeline, including idea filtering, selection, and development processes.
Calculation:(Number of Implemented Ideas / Total Number of Submitted Ideas) * 100%(Often requires a calculated KPI setup[6]) -
Time-to-Market (TTM)
What it does: Measures the average duration from the initial concept or formal project start to the commercial launch of a new product or service.
Benefits: Indicates organizational agility, process efficiency, and speed in bringing innovations to the market, which is crucial for competitiveness.
Calculation:Average time (days/months) from idea approval/project start to market launch -
Percentage of Revenue from New Products/Services
What it does: Tracks the proportion of total company revenue generated by products or services launched within a defined recent period (e.g., the last 3 or 5 years).
Benefits: Directly measures the commercial success and financial impact of recent innovation efforts on business growth.
Calculation:(Revenue from Products/Services Launched in Last X Years / Total Company Revenue) * 100%(Often requires a calculated KPI setup[6]) -
Return on Innovation Investment (ROI²)
What it does: Evaluates the financial return generated specifically from the capital and resources invested in innovation activities and R&D projects.
Benefits: Helps justify innovation spending, assesses the financial efficiency of innovation efforts, and guides future investment decisions.
Calculation:((Financial Gain from Innovation - Cost of Innovation Investment) / Cost of Innovation Investment) * 100%(Requires careful definition and potentially calculated KPIs[6]) -
Innovation Pipeline Velocity
What it does: Monitors the rate at which innovation projects successfully move from one stage of the development pipeline to the next (e.g., Ideation > Concept > Development > Launch).
Benefits: Provides insight into the overall health and efficiency of the innovation pipeline, helps identify bottlenecks, and allows for forecasting future outputs.
Calculation:Percentage of projects advancing from Stage N to Stage N+1 per period -
Employee Participation Rate in Innovation Programs
What it does: Measures the percentage of the total workforce actively involved in formal innovation initiatives (e.g., submitting ideas, joining project teams, attending workshops).
Benefits: Reflects the strength and reach of the innovation culture; gauges employee engagement and buy-in for innovation efforts.
Calculation:(Number of Employees Participating in Innovation Activities / Total Number of Employees) * 100%(Often requires a calculated KPI setup[6]) -
R&D Spending as a Percentage of Revenue
What it does: Indicates the proportion of the company's total revenue that is reinvested into formal Research and Development activities.
Benefits: Shows the strategic commitment and level of financial investment dedicated to fostering future innovation and long-term growth.
Calculation:(Total R&D Expenditure / Total Company Revenue) * 100%(Often requires a calculated KPI setup[6])
Why It Matters:
This dashboard equips innovation leaders and teams with the data needed to steer initiatives effectively. By tracking the entire innovation lifecycle-from idea generation to market impact-it facilitates strategic decision-making, optimizes resource use, demonstrates value, and ultimately helps build a sustainable engine for growth and competitive advantage.