What is a Rental and Lettings Dashboard?
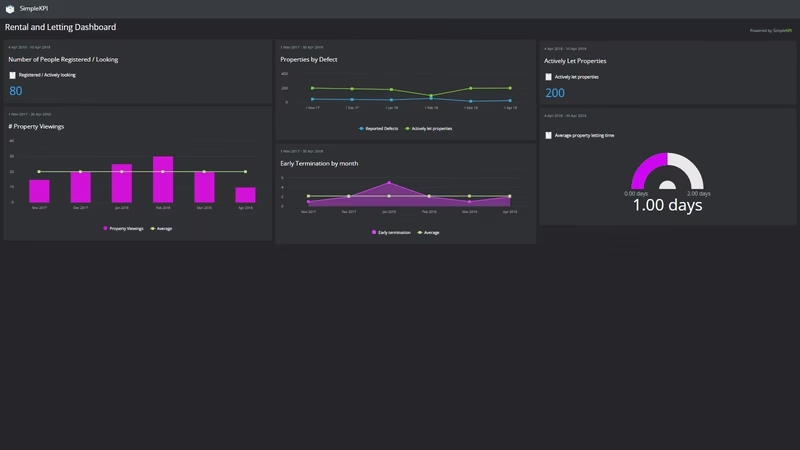
A Rental and Lettings dashboard is a KPI visualization tool that provides a graphical display of the most important KPIs affecting property management. These Dashboards aim to streamline the process of finding tenants, managing issues, and identifying areas that may be affecting tenancies and profit.
Overview
Traditionally, management of properties is a reactive process relying on individual property managers to resolve issue with the properties and tenants after the fact. This resource intensive type of management is often facilitated by software that helps track interactions and tasks.
How quickly issues can be identified then resolved can have a huge impact on both the volume of management series required and also the consistency in revenue flow.
This dashboard is designed to focus on those Rental and lettings KPIs that not only deal with the number of people registering for tenancies and the number of viewings that are made / needed to complete a contract. This Dashboard also aims to track KPIs such as the number of defects per property to attain trends, and early terminations to help identifying issues with properties or screening.
Who is this dashboard for?
This template was created for rental and lettings professionals. Including those individuals working within property management for organizations that manage their own property portfolios. Specifically, this dashboard focuses on both the occupancy of properties the organization manages, and the indicators likely to effect rental incomes.
