What is a Security Firm Dashboard?
A security firm dashboard provides a visualization of industry-focused metrics and KPIs. These dashboards often translate complex security data into easy-to-understand graphs and charts. Typically, a security dashboard will cover incident management, Health and Safety, and compliance.
These dashboards provide managers and supervisors with real-time and historical data that enables them to react and improve the performance of their security firm services.
Overview
Security firms face increasing challenges to their operations, from ensuring sufficient staffing levels, paramount worker safety, to more stringent compliance and governance reporting.
Without access to analytics and real-time data, managers and supervisors often spend an increasing amount of time finding and combining data from multiple sources (including paper-based) into some form of reporting where conclusions can be made.
The same is true for SLA and KPI reporting. As more clients view reporting as a tool to rate the performance of their security firm, more and more resources are devoted to producing reports instead of providing real security services.
Remaining competitive in the current environment has also meant that security firms must now offer more versatile and adaptable security services. Often, this will include reducing staffing and patrols for more mobile and remote monitoring while expanding services to cover personal protection and digital infrastructure.
The pressure to ensure compliance, risk management, and Health and Safety governance has grown significantly in the past five years. With insurance premiums growing, security firms must have the information and analytics to comply with increasing governance while mitigating associated costs.
Security KPI dashboards with a combination of KPIs and metrics provide companies with instant access to performance information. Correctly utilizing dashboards and KPIs allows a security company to deliver better client services, manage operational risk, offer a platform to see opportunities, and ultimately gain a competitive advantage.
To help confront these challenges, we have created three security firm-based dashboard examples covering most areas of operations and governance. The dashboards and KPIs can be customized and expanded if needed.
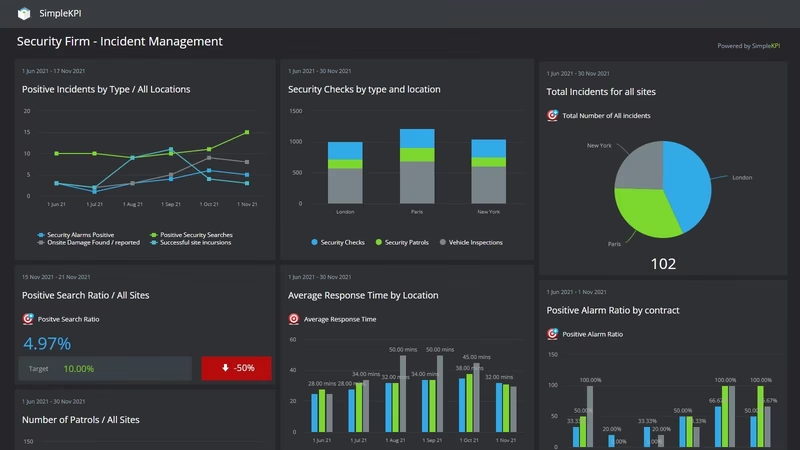
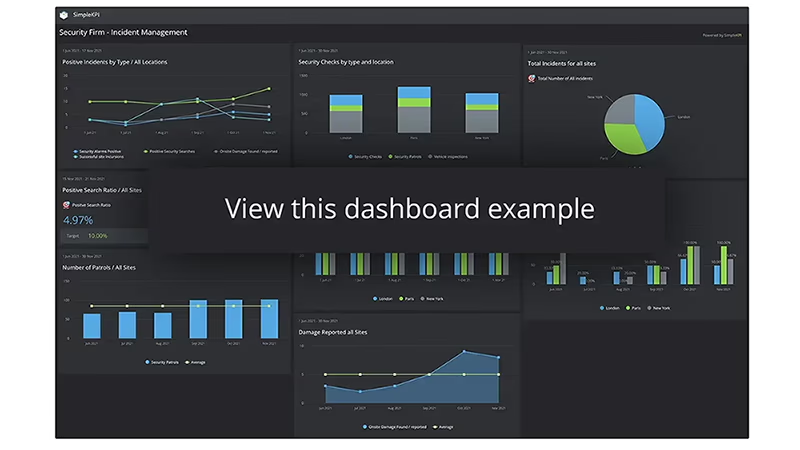
Incident Management Dashboard
Security incidents may be singular or consist of multiple events. Tracking and visualizing these incidents can offer insight into patterns that can lead to predictive management and proactive intervention.
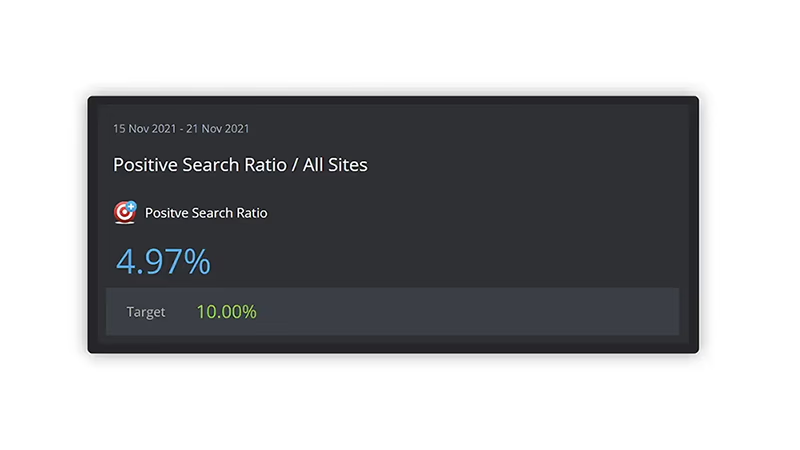
Looking at the ratios of key performance indicators such as positive personal or vehicle inspections can provide information on which areas to target security protocols to be more successful. This information can also be used to predict and manage workloads or staffing levels for different sites or even times of the day.
This dashboard focuses primarily on incidents such as the number of alarms, damage, and flood. It also covers metrics such as the number of patrols and response times of those incidents, providing a complete picture of incidents.
These KPIs can be tracked against location, contract, or individual personnel, giving insights into patterns and behavior.
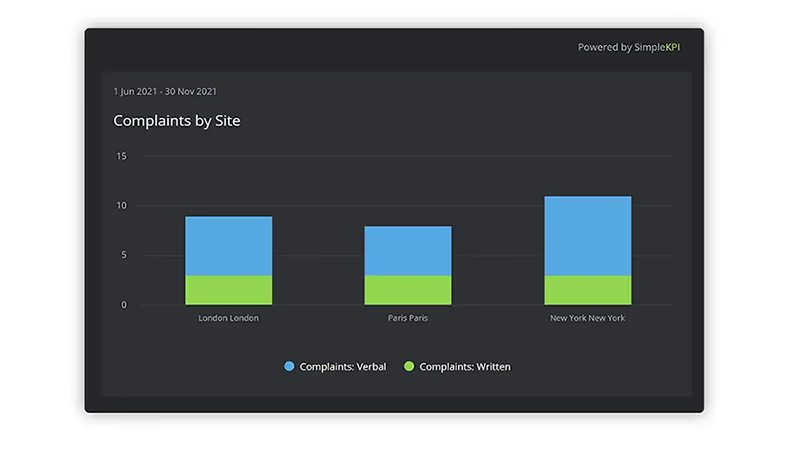
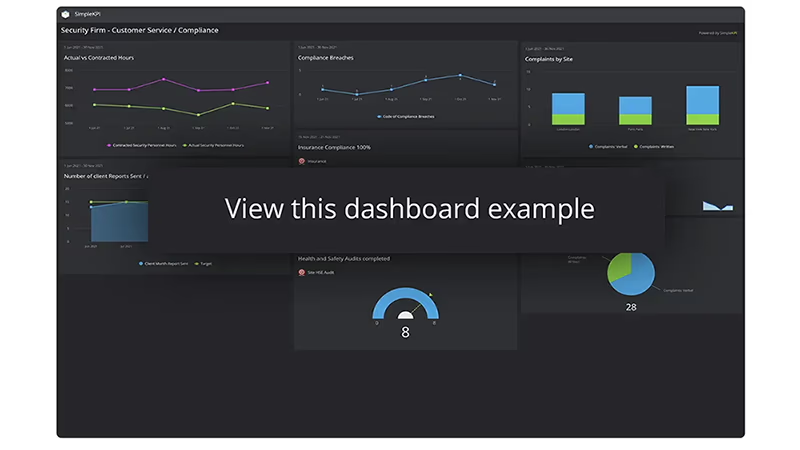
Customer Service / Compliance Dashboard
Managing customer service level agreements and expectations can be made more efficiently using a dashboard. Key performance measures such as the number of positive versus negative complaints can be tracked and analyzed, and improvements can be implemented to improve customer service levels.
Clients want to know if their security contractor is managing and fulfilling the services of the contract. Timely reporting and even sharing real-time dashboards with clients is a proactive approach to contract management that evokes trust and transparency in the company.
This dashboard example focuses on two key areas, customer service, and compliance. It provides performance measures that cover compliance, such as the number of audits for Health and Safety, security audits, insurance coverage, and compliance breaches. It is designed to give a current compliance position and indicate where action needs to be taken to comply with governance.
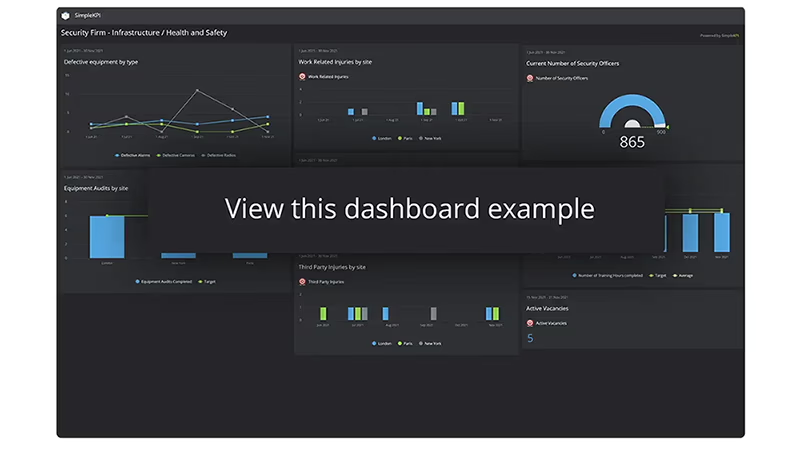
Infrastructure / Health and Safety and Personnel
Health and Safety KPIs for security firms are measurable values used to track and determine the Health and Safety policy status. Providing clarity in Health and Safety incidents boosts confidence and helps reduce future incidents by looking at trends. Knowing how well a security firm handles work-related incidents such as personal injury and third-party injuries also helps reduce insurance premiums and reduces lost work hours.
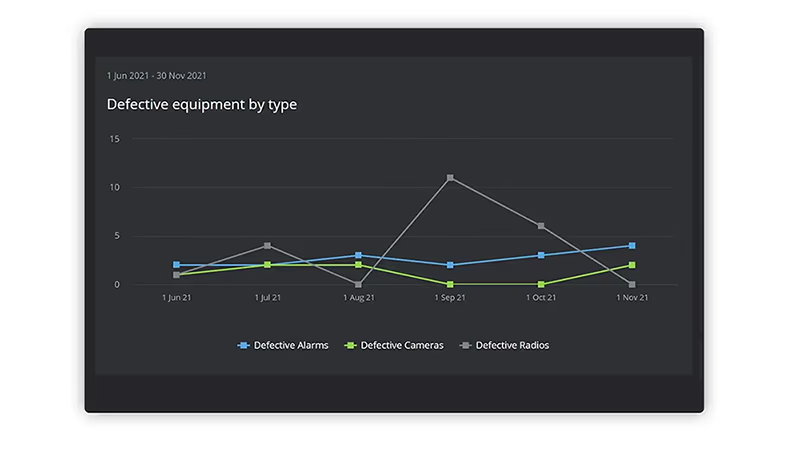
Infrastructure
Keeping a detailed view of infrastructure such as damaged and defective assets can help determine problems with sites, equipment suppliers, or personnel training that needs to be addressed.
This example dashboard covers the main KPIs for infrastructure, Health and Safety and personnel – it can be customized and split into its constituent parts if needed, and charts and graphs can be moved to other dashboards if required.
Who benefits from these dashboards?
Improved company performance, tracking progress towards goals, and increased client communication are all tangible benefits provided by these dashboards.
Reducing the paperwork and amalgamation of data needed for reporting and governance provides benefits in efficiency and resources. However, there are some specific benefits for the various roles within a security firm, such as:
- Security Officers can monitor their own performance, training, and working hours."
- Managers and supervisors can use KPIs on the dashboard, such as the number of incidents, the infrastructure status, and the workloads of Security Officers, to plan resources."
- Legal and governance rely on the status of compliance and audits such as Health and Safety, insurance of employees, and workplace injuries to keep informed and compliant."
- Customer Services would leverage such KPIs as the number of complaints, client audits, and reports that have been provided to clients."