
What I love about "Excel your Business in just three easy steps" conferences is not how incredibly simple and common sense rooted their concepts are, but the number of Key Performance Indicators (KPI) or metrics that are ploughed up as part of the steps to success. I'm not a compulsive counter, (ok maybe a little) but 15 minutes in I'm already on 10 metrics. By the hour mark I have an eye watering 26 must have things to track. Everything from number of applicants for positions to the number of paper clips in the stationary cupboard. I'm starting to get the feeling that most of these business boosting concepts, although wonderfully designed and presented, are falling foul of the age-old trap of tracking just about everything on the business journey.
During the obligatory coffee and biscuit networking session, I ask if there's any place I can get to see all these metrics along with a brief explanation. I'm told that, actually that's pretty difficult as these presentations are 'organic' and 'flow' based on the different industries and areas of business of the audience - and as a consequence may, or may not have the same things to measure each time.
The KPI Challenge
I understand that KPI tracking is entirely subjective, with an almost endless number of variables to consider from the industry in which the business operates, the various departments, the audience, performance type and so on. But if you wanted any business operating in any geographic location selling any goods or services. Are there 5 KPIs that would cover it all? – oh and if you're wondering why 5, well I rolled the dice.
What is a Business?
Before I even started thinking about the KPIs, I needed a business definition. Once I had this then I was able to define the needs of a business as a completely interconnected ecosystem.
I broke this down into a series of 5 statements alongside 5 business pillars:
What do all businesses do?
- They create or provide something of worth…
- That other individuals, businesses or organisations want or need…
- For an amount that they are prepared to spend…
- By means that satisfies the original need and expectation…
- So that enough revenue is generated to prove viable.
5 Business Pillars
- Marketing
- Sales
- Delivery
- Customer Satisfaction
- Finance
My 5 KPIs every business should have
Armed with the structure, business pillars, and the idea that each business unit is in disposable to success, I created a short list for each Pillar and weighed up the pros and cons alongside their neutrality to industry – with overall value to the business compared to other sets of KPIs, so here's my 5 KPIs:
1. Marketing: Leads by Channel
Leads by channel defines the total number of leads or enquiries generated throughout all marketing activities. Then organised into the various channels such as, online, Advertising, Calls, Emails, and so on.
Why this KPI?
It serves a couple of fundamental business marketing needs. Firstly, it allows you to see the total number of leads coming in. This answers questions surrounding the visibility of the business in the marketplace – if you're not being seen then how can you expect people to purchase. Secondly it details those enquiries or leads by the different channels. This information is vital in determining which are your most successful marketing channels, where to focus your time and budget and removes the gut feeling - 'I think this is a great channel for us to market in'.
Others on the shortlist
- Cost per lead
- Marketing Spend
2. Sales: Sales Volume per location, product or service.
Sales tracked by volume as opposed to value either by the location, types of product or services over time.
Why this KPI?
By comparing total sales volumes by location, product or service, you can see not only raw demand for your offerings split by your most popular product or service, but you will also have insight into where your products or services are not doing so well. Enabling you to focus on tackling those reasons.
Others on the short list
- Lead to Sales conversion Rate
- Average Sale per item / service
3. Delivery: Delayed Delivery by cause
This KPI tracks the total number of delivers that were delayed due to factors such as customs delays, adverse weather, poor supplier SLAs and minimum order quantities.
Why this KPI?
You may have a great product or service, and you may have very competitive pricing but how you deliver your offering to your clients can render all your hard efforts to this point worthless. This KPI takes aim directly at the reasons for your delivery problems. Focusing on tackling theses causes ensures your keeping every element of the sales cycle running as a well-oiled machine.
Others on the short list
- Total Delivery costs
- On time Deliveries
4. Customer Satisfaction: Customer complaints by type
The total number of customers complaints generated throughout the sale cycle broken down by the type such as defective products, poor delivery, damages, and refunds.
Why this KPI?
For every customer that complains, 26 other customers will remain silent to you, however, they will tell others about your service and are significantly less likely to repeat business with you. Complaints and feedback will highlight areas of your business from the customer perspective that may have gone unnoticed.
Others on the short list
- Customer Satisfaction Score
- Customer Retention Rate
- First Response time
5. Revenue: Gross Profit Margin
The gross profit margin will highlight whether your pricing strategy for your goods or services is appropriate. The formula is:
Gross profit margin = (revenue – cost of goods sold)/revenue
Why this KPI?
Your gross profit margin should cover your operating expenses and provide a profit.
This KPI is a good way to gauge the health of a business. It removes the guess work from business viability and helps to focusing on various other areas of the business such as pricing and supplier expenses.
Others on the short list
- Net Profit
- Revenue this period
The 5 essential KPIs in action
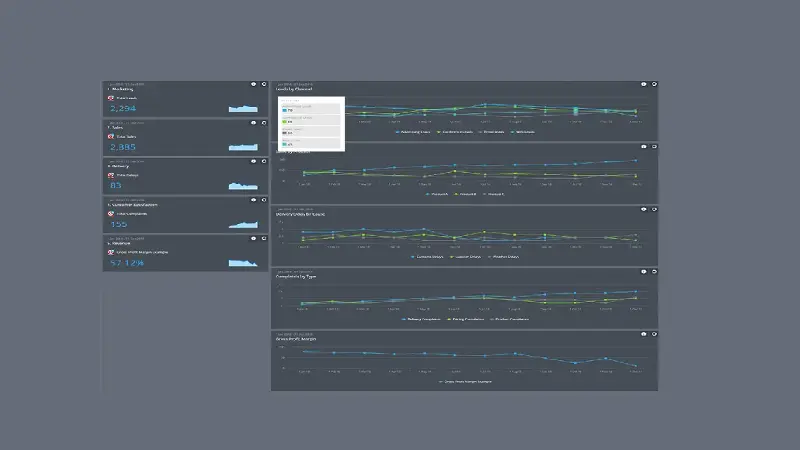
See these 5 KPIs on a live Dashboard example
Clearly a business would be looking to expand on this KPIs set to more closely fit the strategic goals of the business. But if you were looking to take this further then here is a basic dashboard showing how a simple KPI Dashboard with my top 5 would look.

by Stuart Kinsey
Stuart Kinsey writes on Key Performance Indicators, Dashboards, Marketing, and Business Strategy. He is a co-founder of SimpleKPI and has worked in creative and analytical services for over 25 years. He believes embracing KPIs and visualizing performance is essential for any organization to thrive and grow.