Streamlining Insurance Claims with KPI Dashboards
Processing insurance claims is a balancing act. Policyholders expect fast resolutions, regulators demand accuracy, and the business needs to keep costs under control. When any one of these slips, the knock-on effects can be significant — from rising customer churn to inflated operational expenses.
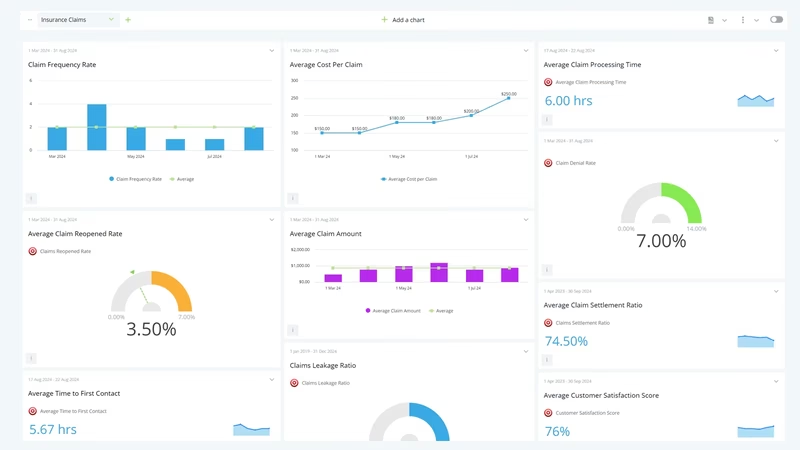
An Insurance Claims KPI Dashboard pulls together the metrics that matter most — resolution speed, cost efficiency, customer feedback, throughput, and fraud detection — so claims teams can spot issues early and act before they snowball.
Whether you're running a small specialist insurer or overseeing claims across multiple lines of business, this dashboard gives you a clear, real-time picture of how your claims operation is performing.
What Is an Insurance Claims KPI Dashboard?
Overview
An Insurance Claims KPI Dashboard centralizes the data that drives claims performance into a single, easy-to-read view. Instead of piecing together information from spreadsheets, email threads, and legacy systems, claims managers and executives can monitor key indicators in real time. Charts and widgets surface trends in processing speed, costs, satisfaction, and fraud, making it simple to identify bottlenecks and allocate resources where they'll have the greatest impact.
Who benefits from this dashboard?
- Claims Managers: Track team throughput, identify bottlenecks in the claims pipeline, and ensure resolution times stay within target.
- Customer Service Teams: Monitor satisfaction scores and response quality to keep policyholders informed and reduce complaint escalations.
- Fraud and Compliance Teams: Review fraud detection rates, flag unusual patterns, and ensure audit-ready documentation is maintained.
- Insurance Executives: Access high-level views of cost per claim, settlement ratios, and overall operational efficiency to guide strategic decisions.
Create separate dashboard views for different claim types — auto, property, health — so each team sees the metrics most relevant to their workflow.
Dashboard Example Overview
This dashboard focuses on five essential insurance claims KPIs:
- Claim Resolution Time: The average number of days from when a claim is filed to when it is fully settled. Long resolution times are a leading driver of customer dissatisfaction and can signal process inefficiencies or staffing gaps.
- Customer Satisfaction Score: Post-resolution feedback collected from policyholders, typically via survey or NPS. This metric captures the human side of claims — communication quality, perceived fairness, and overall experience.
- Cost Per Claim: The total operational cost incurred to process and settle a claim, including labor, investigation, and administration. Tracking this over time reveals whether process improvements are actually reducing expenses.
- Claims Processed Per Day: Daily throughput across your claims team. Monitoring this alongside resolution time helps you distinguish between teams that are fast and accurate versus those simply rushing to close files.
- Fraud Detection Rate: The percentage of submitted claims identified as potentially fraudulent. A rising detection rate can indicate better controls, but it may also reflect an uptick in fraudulent activity that warrants further investigation.
List of Insurance Claims KPIs
| KPI Name | Typical Target | Description / Calculation |
|---|---|---|
| Claim Resolution Time | < 15 days | Average days from claim submission to final settlement. |
| Customer Satisfaction Score | > 85% | Percentage of policyholders rating their claims experience as positive. |
| Cost Per Claim | Decrease YoY | Total processing cost divided by number of claims settled. |
| Claims Processed Per Day | Varies by team size | Number of claims moved to a resolved status each day. |
| Fraud Detection Rate | > 5% | Flagged fraudulent claims as a percentage of total submissions. |
Why Insurance Claims Dashboards Matter Right Now
The insurance industry is under more pressure than ever to deliver faster, fairer outcomes while keeping costs in check. Here's why a dedicated claims dashboard is no longer optional:
- Rising customer expectations: Policyholders compare claims experiences to the instant service they receive in other industries. Slow or opaque processes drive churn.
- Regulatory scrutiny: Regulators increasingly expect insurers to demonstrate fair handling timelines and consistent outcomes across demographics.
- Fraud complexity: Fraudulent claims are becoming more sophisticated. Real-time detection metrics help teams respond faster and protect legitimate policyholders.
- Cost pressures: With premiums under competitive pressure, reducing the cost per claim is one of the most direct paths to improved profitability.
- Remote and hybrid teams: Distributed claims teams need shared visibility into workloads and performance to stay aligned without constant check-ins.