What is a Media and Comms KPI Dashboard?
A media and communications KPI dashboard is a specialized tool for media and communication industry professionals to track performance. It consolidates essential metrics related to earned media (press coverage), owned media (websites, social channels), and paid media (advertising). By tracking these key performance indicators (KPIs), practitioners gain actionable insights, make informed decisions, and adjust their strategies.
Why Choose This Dashboard?
In the dynamic media and communications landscape, companies grapple with the dual challenge of remaining relevant and maximizing impact. This KPI Dashboard is designed to illuminate performance metrics and guide strategic choices. These include:
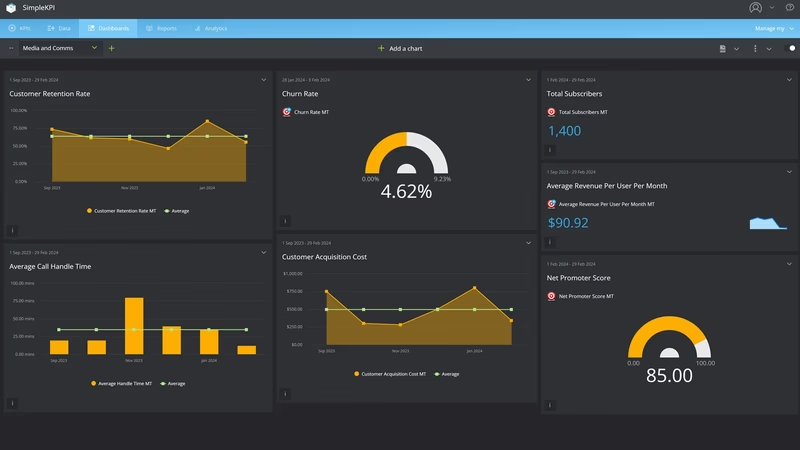
- Comprehensive Insights: The template consolidates critical KPIs, offering a panoramic view of your organization’s well-being. From Total Revenue to Churn Rate, each metric contributes to the overarching narrative.
- Strategic Orientation: Align your endeavors with organizational objectives - Ensuring purposeful actions by monitoring Total Subscribers, New Customers, and Customer Lifetime Value.
- Customer-Centric Lens: Dive into audience understanding. KPIs such as Customer Retention rate and Net Promotor score reveal your resonance with customers.
- Operational Efficiency: Delve into operational effectiveness through KPIs such as Average Handle Time and Time on Call. Optimize processes for enhanced customer satisfaction.
- Financial Vitality: To gauge financial performance. Cost of Sales and Marketing, Average Revenue Per User Per Month, and Customer Acquisition Cost inform resource allocation.
- Customer Lifecycle: The Average Customer Lifespan metric sheds light on enduring relationships. Leverage insights to extend customer journeys.
The Media and Communications KPI Template transcends mere data—it’s your compass. Use it to navigate the ever-evolving terrain, make informed decisions, and propel your organization toward success.
Who is this dashboard for?
This dashboard is aimed at the fast-paced Media and Comms industry; specifically, this dashboard would be used by:
Public Relations (PR) Managers and Teams:
PR professionals monitor media mentions, track brand visibility, and assess the impact of their campaigns.
They use the dashboard to measure earned media coverage, analyze sentiment, and adjust strategies accordingly.
Marketing and Advertising Managers:
Marketing teams evaluate the effectiveness of paid media campaigns (such as online ads or sponsored content).
The dashboard helps them track metrics like impressions, clicks, and conversion rates.
Content Managers and Social Media Specialists:
These professionals focus on owned media (websites, blogs, social channels).
They use the dashboard to analyze website traffic, engagement, and content performance.
Executives and Stakeholders:
Business leaders and decision-makers rely on the dashboard for high-level insights.
It informs strategic decisions, resource allocation, and overall communication goals.
What problems is this Media and Comms Dashboard trying to address?
A media and communications KPI dashboard serves as a critical solution to address several key challenges faced by media and communication industry professionals. Let’s explore these problems and how the dashboard aims to solve them:
Information Overload and Data Complexity:
Problem: Media and communication professionals deal with vast amounts of data—earned media mentions, social metrics, advertising performance, and more. Without proper organization, this data can overwhelm decision-makers.
Solution: The dashboard streamlines relevant KPIs, presenting essential information concisely and visually digestible. It helps users focus on actionable insights without drowning in data.
Lack of Real-Time Visibility:
Problem: Timeliness is crucial in media and communication. Waiting for manual reports delays decision-making and responsiveness.
Solution: The dashboard provides real-time updates, allowing professionals to monitor trends, detect anomalies, and respond promptly. It bridges the gap between data collection and informed action.
Difficulty in Performance Measurement:
Problem: How do you measure the impact of PR campaigns, media outreach, or content efforts? Traditional methods lack precision.
Solution: The dashboard includes specific KPIs (such as earned media mentions, sentiment analysis, or website traffic) directly related to communication success. It quantifies performance and informs strategy adjustments.
Stakeholder Communication and Reporting:
Problem: Communicating results to executives, clients, or stakeholders can be challenging. Lengthy reports may not resonate.
Solution: The dashboard generates concise, visual reports highlighting achievements, challenges, and areas for improvement. It simplifies communication and facilitates data-driven discussions.