Introducing our Production KPI Dashboard
Keeping track of production performance doesn’t need to be complicated. With SimpleKPI’s Production Dashboard, all your key metrics, measures, and KPIs are pulled into one easy-to-use platform. Instead of juggling spreadsheets or piecing together data from different sources, SimpleKPI gives a clear view of what’s happening on the production floor in real time.
From tracking efficiency and downtime to measuring costs and output, this dashboard simplifies complex data into visuals that everyone can understand, helping your team make quicker, smarter decisions to keep production moving smoothly.

What is a Production KPI Dashboard?
A Production dashboard is a data-driven visualization of a manufacturing process. Graphs, charts, and tables display the Metrics, Measures, and KPIs used to monitor performance. The dashboards provide real-time tracking and historical analysis leading to efficiencies in manufacturing processes and cost reductions.
-
Step 1 Pick your KPIs
Align each KPI to a clear business goal and define ownership, frequency, and targets before building the dashboard.
Start by listing the production outcomes that matter (e.g., throughput, quality, cost, reliability), then select KPIs such as OEE, Downtime, Scrap/Defect Rate, First Pass Yield, Cycle Time, and Capacity Utilization that directly influence those outcomes.
Group KPIs by purpose (efficiency, quality, maintenance) and by audience (plant, line, shift) so charts and reports can be filtered by Groups later.
Document units, calculation methods, data sources, and update cadence to keep definitions consistent across teams. Keep the KPI set small and actionable to prevent dashboard clutter and make insights obvious at a glance.
-
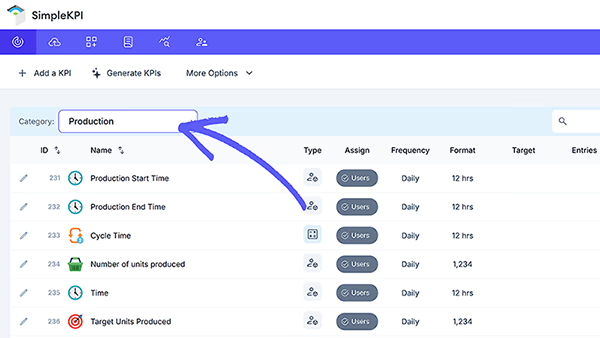
Step 2 Add them to SimpleKPI
Create KPIs manually or import them in bulk from a spreadsheet template.
To import: go to the KPIs tab, choose "Import a spreadsheet", download the example file, then populate KPI Name, Unit, Frequency, Category, Direction, and optional Description/Target; upload and import to create all KPIs at once.
Manual adds are best for a handful of KPIs; imports are faster for full libraries and preserve consistent metadata.
Ensure Units and Frequency match your data entry plan to avoid rework later, and use Categories to separate production metrics from other departments.
-
Step 3 Connect your data
Choose a data entry method that matches your volume and refresh needs: manual entry for quick starts, spreadsheet uploads for historical/bulk data, or automated connections for live updates.
From the Data entry tab, you can import spreadsheets using the provided template; or set up Data Connections (e.g., Google Sheets) so SimpleKPI pulls data on a schedule with ISO 8601 dates and mapped KPIs/users.
For integrations beyond spreadsheets, use built-in connectors or the API to automate reliable, real-time updates and reduce manual errors.
Top teams automate data flow so dashboards always reflect current performance.
-
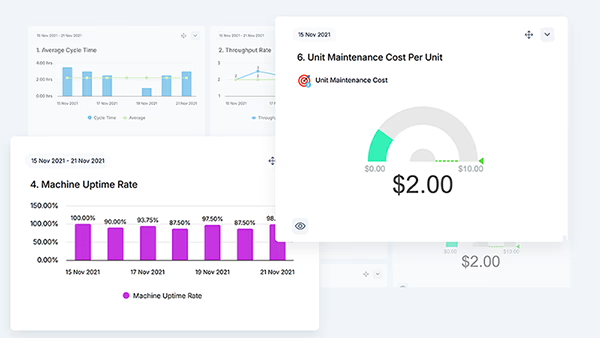
Step 4 Choose your chart types
Create a dashboard, then add charts that tell a clear story from overview to drill‑down.
Use trend charts to track production KPIs over time (daily/weekly/monthly), gauges for “at‑a‑glance” status against targets, KPI tiles for headline metrics, and reports/league tables to compare Groups (e.g., lines, shifts) or users.
In the chart builder, pick the KPI, date range, and frequency; then customize filters (users/groups), display options (targets, averages, values), and colors/sizes to fit your layout.
Arrange charts in a logical grid so leaders can spot trends, bottlenecks, and variances quickly without scrolling.
-
Step 5 Share & refine
Share dashboards with stakeholders, enable full‑screen display for stand‑ups and shift handovers, and iterate based on feedback.
Use dashboard settings to manage layout and visibility, embed charts externally if needed, and standardize views by audience (executives vs. line managers).
Review adoption and data quality weekly, retire unused charts, and tighten definitions where confusion persists.
As processes change, revisit targets, frequencies, and chart selections so the dashboard remains a reliable decision tool rather than a static report.
-
21 Essential Production KPIs
Discover 21 production-focused KPIs you can use straight away
-
KPI Dashboards: A Comprehensive Guide
Learn how to plan, design, and share effective KPI dashboards
-
Support Portal
The complex data used to populate dashboard charts and graphs comes from machinery, sensors, devices, and user inputs. Managers and operators then use these dashboards to make insightful decisions.
Overview
SimpleKPI's Production KPI dashboard offers a centralized and flexible management and performance improvement tool. This flexibility provides manufacturing companies with the agility needed in an industry with ever-tightening operational margins.
Taking a holistic approach that includes the entire production environment, not just relying on the performance of machinery, but one that provides for Management, infrastructure, costs, and materials, is the key to sustained growth.
Transforming the data for all these components into an easily digestible form can only be achieved with dashboards.
When creating dashboards for production environments, several key factors need to be kept in mind. Firstly and most important is to have a clear plan outlining what the dashboard is trying to achieve. This plan would typically include everyone reliant on the content, for example, operators through to senior managers - each contributing only the essential information they need.
Who benefits from this dashboard?
Production dashboards simplify large data sets. Typically these come from various sources and deliver that information through understandable visuals to the right people to make informed decisions.
In a production environment, there may be several dashboards covering various roles and responsibilities:
Operators may be focused on throughput, change over time and the rate of defects.
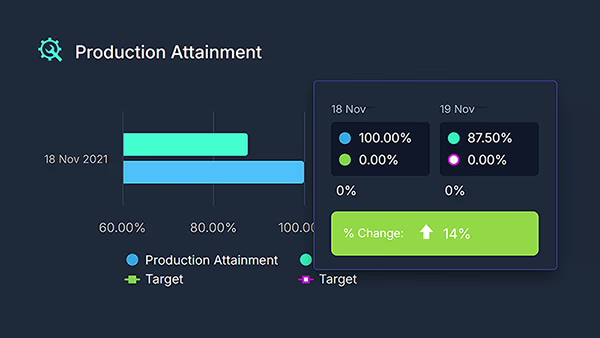
Managers and supervisors use KPIs on the dashboard, such as production rates, demand forecasting, and avoided cost.
Maintenance Staff would monitor KPIs such as Mean time between failure (MTBF), Planned Maintenance Percentage (PMP), and uptime rates.
Senior Management, planners including the finance department would rely on KPIs such as Overall Equipment Effectiveness (OEE), Work in Progress and Capacity Utilization.
Tip: The best production dashboards balance simplicity with depth, showing each role only what they need.
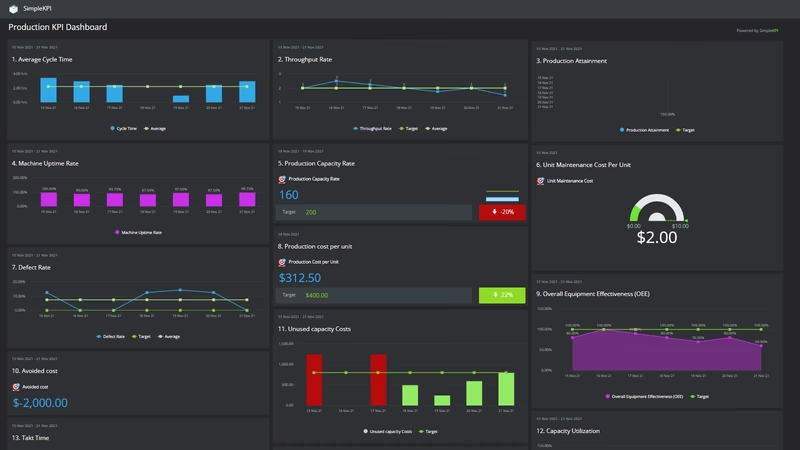
Dashboard Example Overview
This example brings together the core production KPIs teams care about: Cycle Time, Throughput, Downtime, Scrap, and Attainment.
Built directly in SimpleKPI, it combines clean KPI tiles, flexible dashboards, and ready-to-use chart types — perfect for both the shop floor AND the boardroom.
Creating a Production KPI Dashboard in SimpleKPI
Follow these five quick steps to build and share a live dashboard.
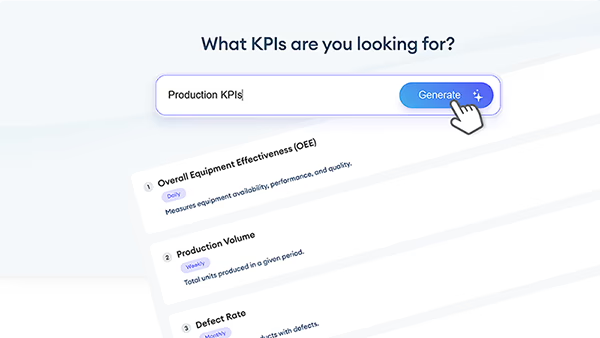
Generate Your Own Production KPIs
Use our Free KPI Generator to create a tailored Production KPI set for your plant. Get KPI names, descriptions, formulas, and examples — then export to Excel or open in SimpleKPI.
Download the Production KPIs Spreadsheet
Kickstart your tracking with an editable spreadsheet of ready-to-use production KPIs. Import into SimpleKPI or use offline. Download 21 Production KPIs in Excel
More Resources
A Production KPI is a measurable indicator used to track how well a manufacturing process meets its goals. Common examples include throughput, cycle time, downtime, first-pass yield, scrap rate, and Overall Equipment Effectiveness (OEE). By monitoring these KPIs over time, teams can spot bottlenecks, prioritize improvements, and quantify the impact of changes.
Production dashboards are useful for operators, supervisors, maintenance teams, production planners, quality teams, finance, and senior management. Operators track live performance and defects, supervisors monitor workflow and shift targets, maintenance watches uptime and MTBF, planners and finance track capacity, costs, and demand, while leadership uses high-level KPIs to align strategy and performance.
Yes. SimpleKPI supports importing spreadsheets, connecting live data feeds, and integrating with production systems or sensors. You can combine manual entries with automated machine data to keep KPIs current, set update schedules, and standardize formats so your dashboards stay accurate and real-time.