
In this article:
- Intro
- The coffee shop revolution
- Staying Competitive and Adapting
- The rise of Small Business Analytics
- Coffee Shop KPIs
- Coffee Shop Dashboards
- Implementing a Coffee Shop Dashboard
- Conclusion
Intro
The draw of coffee shops and their inherent rise in the specialty eatery industry has been fuelled by a blend of relaxed atmosphere, consumer taste, and location.
Excellent service coupled with an array of caffeine-induced specialty coffees, such as lattes, cappuccinos, and espressos, has made these cafes a mainstay of many people's morning routines.
With coffee shops popping up and increasing in popularity, it would be easy to assume that this simple business model is a quick win. But underneath this calm facade hides the intensely competitive environment in which they operate.
Marketing, upselling, and keeping relevant to almost daily changes in customer tastes reveal a bitter struggle for survival and growth.
So how do coffee shops leverage their data to stay competitive in challenging times?
The coffee shop revolution
Although drinking coffee at home is still the most popular way of consuming the beans, the popularity of coffee shops saw a massive uplift until 2020. The market in the US alone is worth an estimated 47.5 billion dollars, with an average growth rate of 2.7% annually over the last five years.
Coffee consumption globally has also been accelerating; over 166.63 million 60-kilogram bags of coffee are now consumed annually.
This rise in popularity came with the rapid growth of coffee shops as an alternative destination to restaurants and bars. People embraced the coffee shop for its relaxed social atmosphere and low price points.
However, when social interaction was curtailed in early 2020, a key component of their success was removed, leading to mass closures. Now, as the world gradually reopens, coffee shops face even more challenges as new establishments rush to fill the voids left by other high street businesses not able to ride out the storm.
Staying Competitive and Adapting
Staying competitive in a 'normal environment' is hard enough, but as coffee shops operate on small margins, have high footfall, and are subject to external influences outside of their control, it is no surprise that between 50% – 74% of independent coffee shops will fail in the first five years.
The main reason cited was the lack of preparation for ownership. The dream of owning a small coffee shop, coupled with a relaxing atmosphere and simple business model, was clouding the complexities and challenges owners needed to overcome.
Like every other business, owners need to use the data they produce. Having a hunch that Turkey Bacon Sandwiches are a great complement to coffee is one thing. Knowing that your sandwich margins are tiny compared to filled croissants is another.
Tracking and learning from even these basic examples enables owners to adapt to customers' needs and stay competitive.
The rise of Small Business Analytics
Small business owners understand they should put their data to work, but many fail. Most cite the lack of time and training. However, this is changing rapidly with advances in automation and the proliferation of data tools.
A Onepath survey found that 67% of small businesses are now spending more than $10K a year on analytics. Business intelligence is now shifting from an advantage once held by larger companies to SMEs.
Data can now be transformed into easy-to-understand performance charts that owners can interpret to make informed decisions regarding their business.
Using KPI tools to plan for growth, staffing, and budgeting now empowers owners to stay competitive and keep franchises at bay.
Coffee Shop KPIs
Coffee shops are like any other business in terms of the data they produce.
Every sale, table, social media post, and online order alone will generate substantial data in which insights can be garnered.
At this point, the data is raw and unrefined; it cannot highlight anomalies or opportunities, and it is not yet at a stage where an owner can make any informed decisions.
This is where Key Performance Indicators help bridge the gap between raw and valuable.
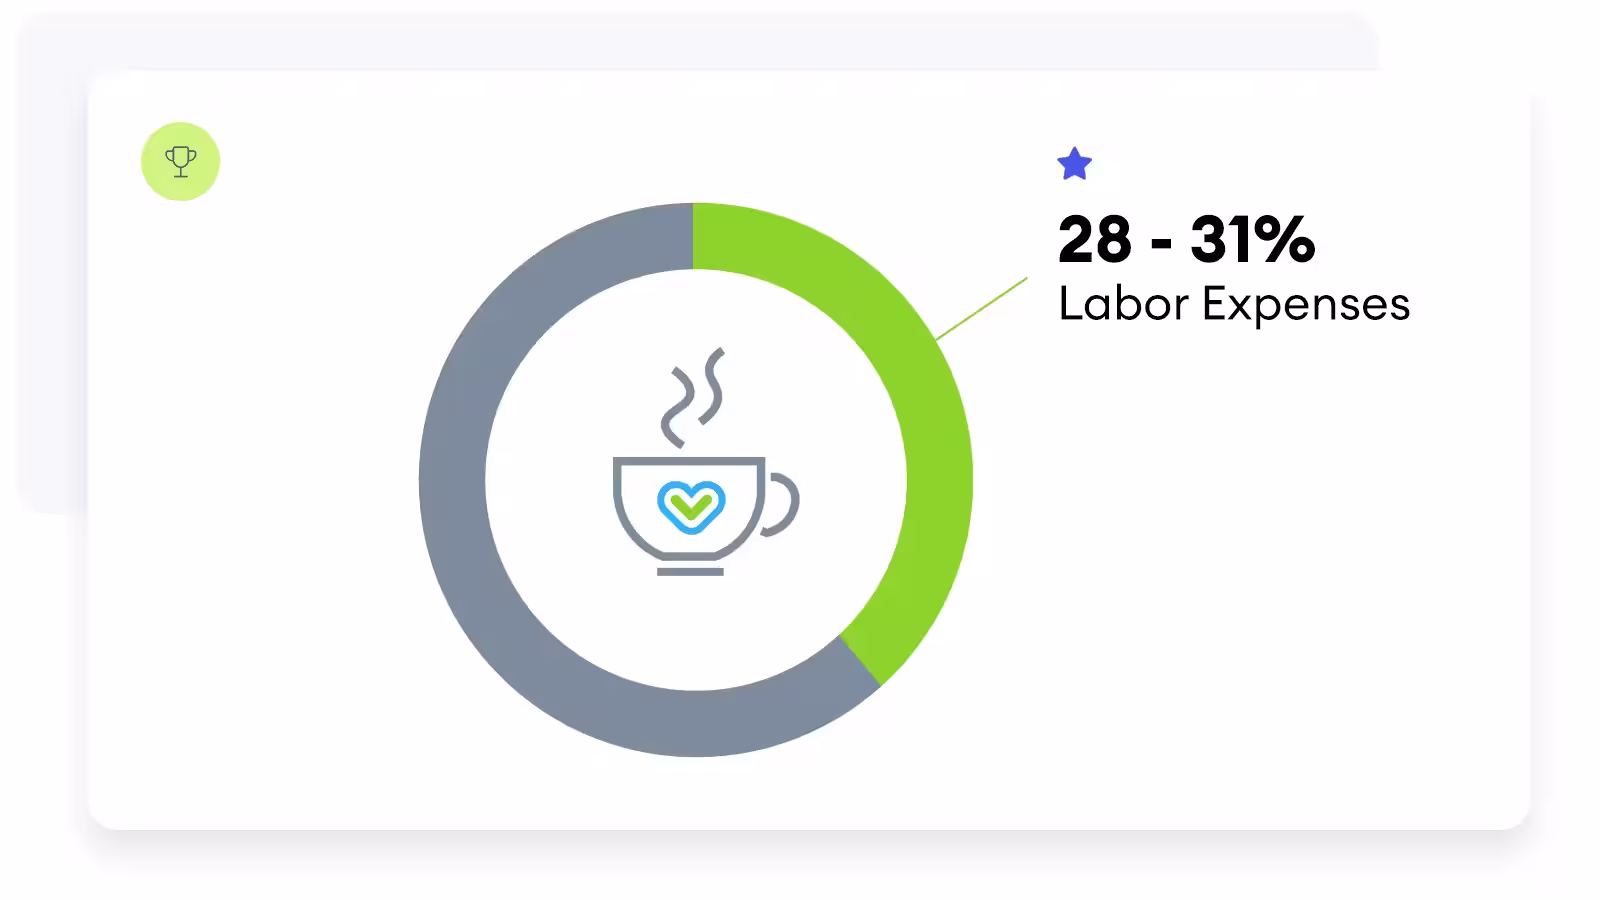
For example, labor expenses are the most significant financial outlay for coffee shops amounting to between 28 – 35% of their expenses. Included in this are both the cost of salaries and recruitment.
So, a KPI that takes the cost of salaries plus the cost of recruitment coupled with KPIs for retention and turnover can help reduce recruitment costs, reduce lost opening hours, and keep costs stable.
With so much data available, it's worth cautioning about tracking too much. All the benefits that can be derived by putting your data to work can be undone by trying to track too much.
When creating Coffee Shop KPIs, they can be broadly assigned to three main categories, and a typical stack of KPIs would be:
- Expenses Salaries
This KPI measures the total amount spent on employee salaries and wages within a specific time period (e.g., monthly or annually).
Formula: Sum of all individual employee salaries and wages. - Employee Turnover
Employee turnover reflects how many workers leave a business, either voluntarily or involuntarily. It impacts organizational performance and can lead to costs.
Formula: Turnover Rate (%) = (Number of Employees Who Left / Average Number of Employees) × 100. - Employee Retention Rate
This KPI measures how well an organization retains its employees. A higher retention rate indicates better employee satisfaction and engagement.
Formula: Retention Rate (%) = [(Total Employees at Start of Period - Employees Who Left) / Total Employees at Start of Period] × 100. - Net Profit
Net profit represents the total profit after deducting all expenses (including salaries, infrastructure, and food costs) from total revenue.
Formula: Net Profit = Total Revenue - Total Expenses. - Infrastructure Expenses
Infrastructure expenses cover costs related to facilities, utilities, maintenance, and equipment.
Formula: Sum of all infrastructure-related costs. - Coffee and Food Expenses
This KPI tracks the total expenses incurred for coffee and food items (e.g., ingredients, supplies) in a coffee shop or restaurant.
Formula: Sum of coffee and food-related costs. - RevPASH (Revenue per Available Seat Hour)
RevPASH measures revenue generated per available seat hour in a restaurant or café.
Formula: RevPASH = Total Revenue / Total Available Seat Hours. - Food Strike Rate %
Food strike rate represents the percentage of orders that include food items.
Formula: Food Strike Rate (%) = (Number of Food Orders / Total Orders) × 100. - Revenue Per Employee
This KPI calculates the average revenue generated by each employee.
Formula: Revenue Per Employee = Total Revenue / Total Number of Employees. - Total Orders
The total number of orders received by the business.
Formula: Count of all orders. - Food Orders
The number of orders specifically for food items.
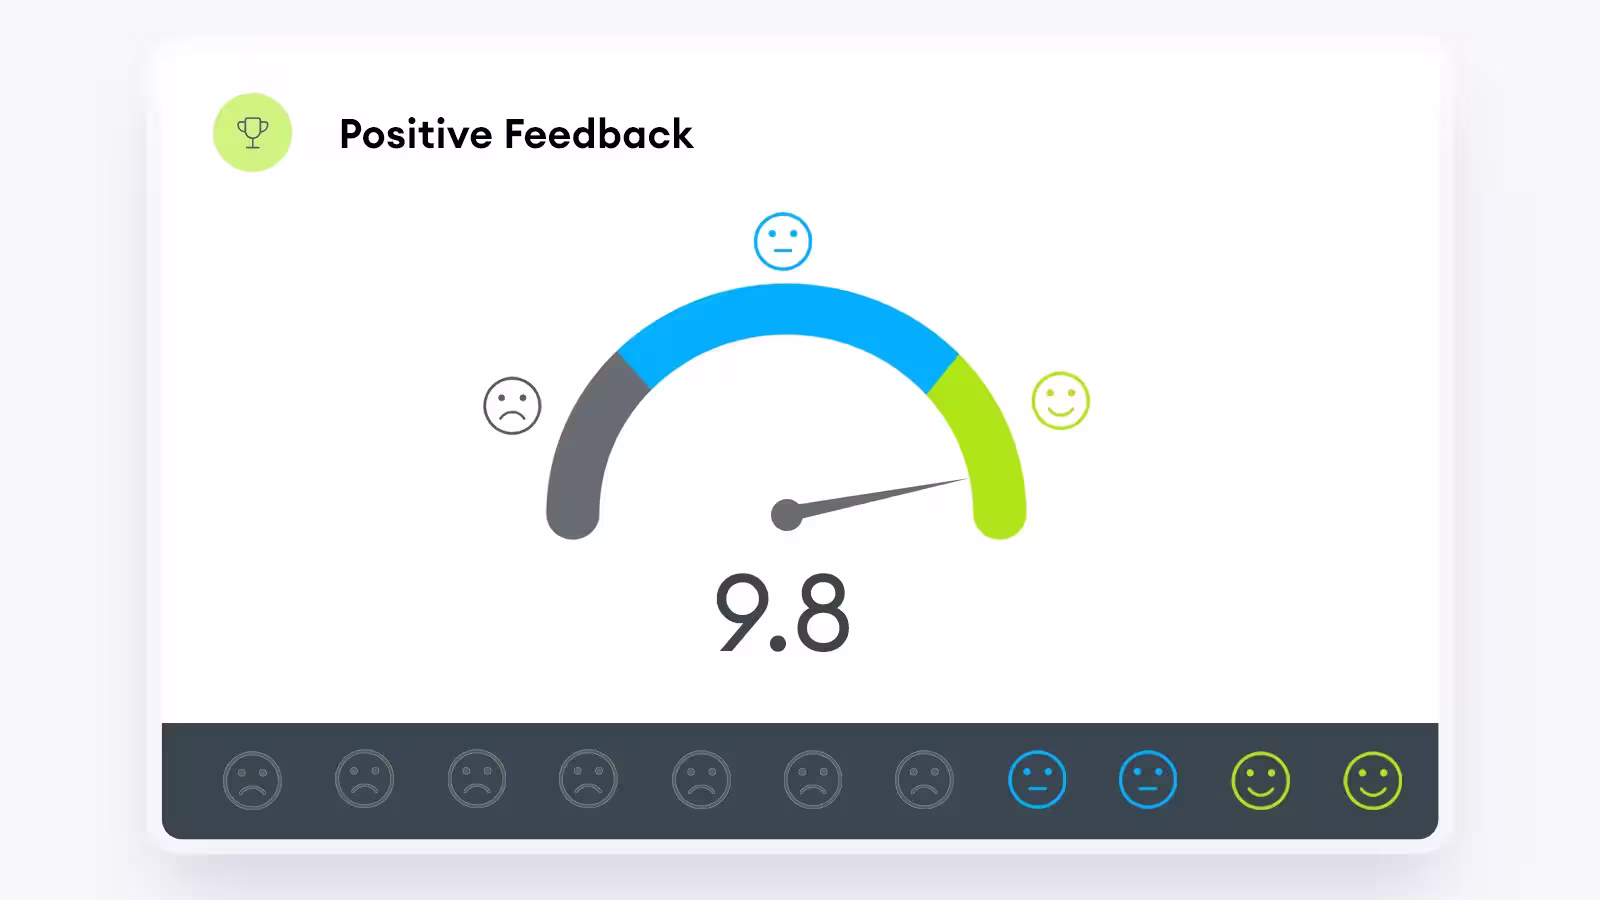
Formula: Count of food-related orders. - Positive Feedback
The count of positive reviews or feedback received from customers.
Formula: Count of positive feedback instances. - Negative Feedback
The count of negative reviews or feedback received from customers.
Formula: Count of negative feedback instances. - Customer Loyalty Cards
The number of active customer loyalty cards issued by the business.
Formula: Count of active loyalty cards.
Resourcing
Revenue
Customer Services
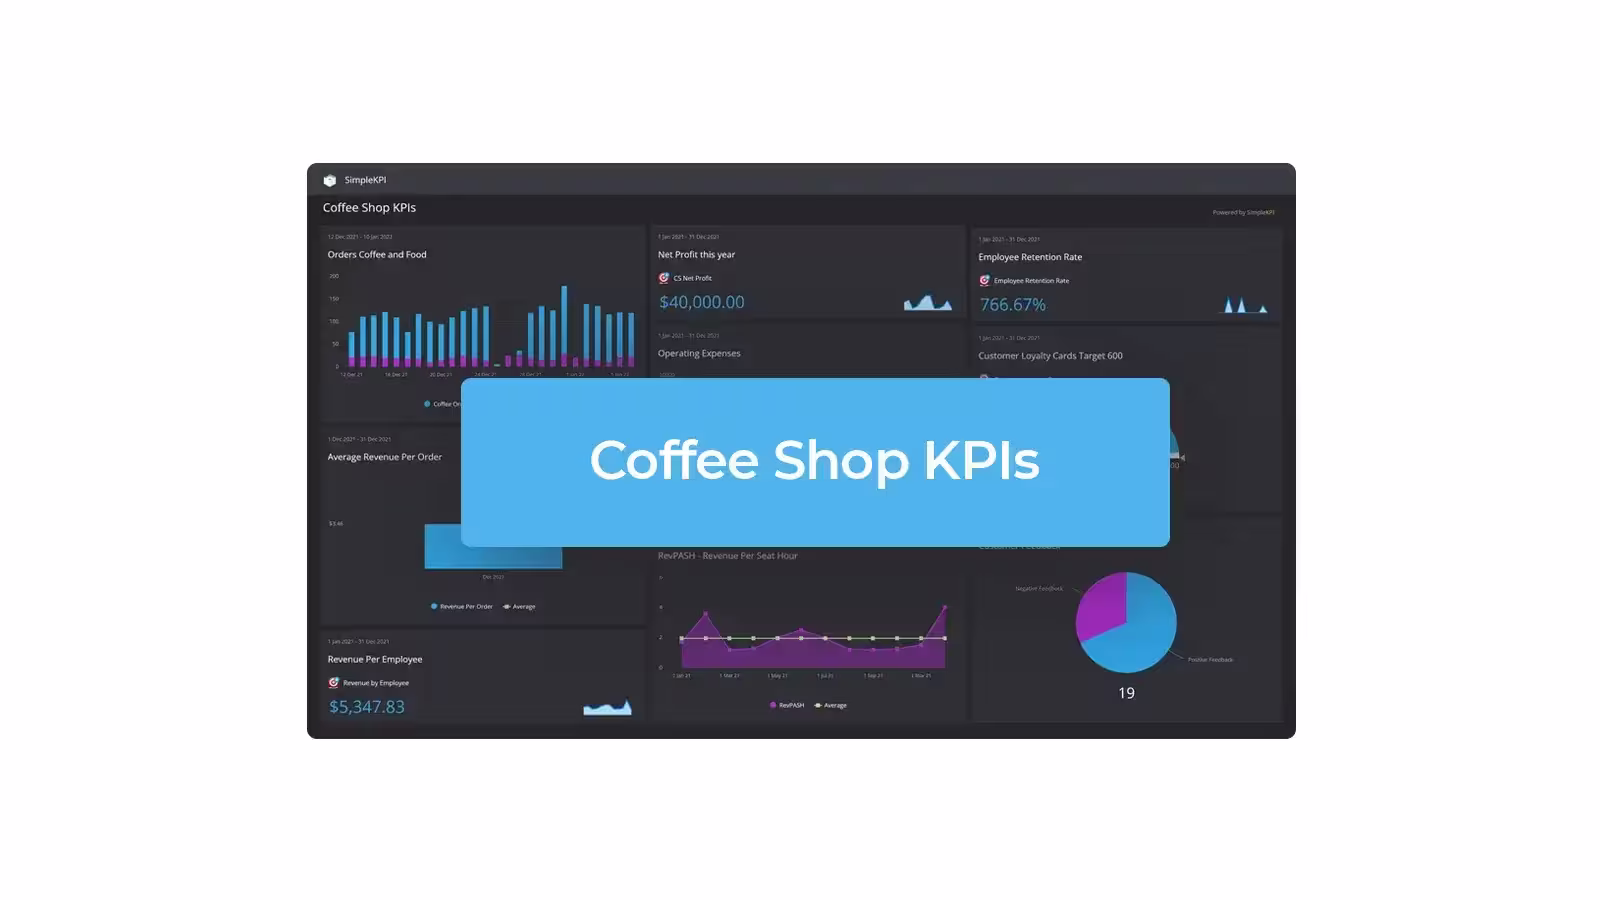
Coffee Shop Dashboards
The vast majority of coffee shops have owner-managers; their time is divided between nearly every aspect of the business. From serving to finance, this time pressure takes its toll on owners and is cited as a significant contributor to coffee shop failure.
So, unsurprisingly tasks such as growth strategies or opportunities to optimize are last on the 'to-do' list.
This is where KPI Dashboards can plug the gap between the day job and the business health.
A Dashboard that displays the most important KPIs for service, revenue, and staffing levels can automatically ease the burden on owners. They can also keep owners informed of the health of the business in real-time without having to collate the data at the end of every week.
Implementing a Coffee Shop Dashboard
As dashboard software tools have become more automated, accepted, and most importantly within budgets, they are becoming the standard in reporting across SMEs.
Data from POS systems, financials from accounting systems, and even customer feedback through in-store feedback devices such as kiosks automate obtaining data.
Many dashboard tools are available that will facilitate this data into meaningful dashboards. Some focus on specific industries, and others take a more holistic approach to KPI management.
To help you get started with managing your Coffee house KPIs we've put together a best practice dashboard that covers the Key Performance Indicators described in this post. You can access the Coffee shop dashboard here.
Conclusion
Owning and operating coffee shops can be demanding. Adapting to a rapidly changing environment is now a reality in the competitive eateries industry.
Having a KPI strategy and access to tools to make decisions for the benefit of growth and competitiveness is now an essential element of success.
Tools such as KPI Dashboards are no longer to the exclusivity of larger companies. Both cost and access have enabled providers to offer SME's the same benefits as franchises and large companies.
Putting data to work and monitoring coffee-based KPIs allows owners to focus on providing the fundamentals that attract loyal customers; that homely service, a relaxed atmosphere, and above all else, great coffee.

by Stuart Kinsey
Stuart Kinsey writes on Key Performance Indicators, Dashboards, Marketing, and Business Strategy. He is a co-founder of SimpleKPI and has worked in creative and analytical services for over 25 years. He believes embracing KPIs and visualizing performance is essential for any organization to thrive and grow.