
What’s in this guide
Taking your performance goals from paper to reality can be a daunting task. Understanding what, how, and when to track your most important metrics will provide you with a fundamental grounding to get the most out of your data, grow your business, and make everything more efficient.
This guide aims to provide a step-by-step guide to help smooth out that process, taking you through the basic principles of performance management, including identifying your KPIs and setting up your KPI software to provide engaging KPI Dashboards and reports.
In this guide...
- What is SimpleKPI?
- Identifying your KPIs
- Templates and Examples
- Adding Your KPIs to SimpleKPI
- Creating Users, Departments, and Teams
- Connecting your Data
- Building a KPI Dashboard
- Generating KPI Reports
- Sharing your Reports and Dashboards
- Wrapping up
What is SimpleKPI?
SimpleKPI is an online KPI management tool. It allows you to create, track and visualize Key Performance Indicators on dashboards and reports. It provides a streamlined approach to KPI tracking that reduces setup time and minimizes complexity; while still providing a powerful and flexible platform to measure and monitor your data.
To follow along with this setup, you will need an existing account with SimpleKPI, or you can take a free trial of the software here
Identifying your KPIs
Most organizations already have a good grasp of the data they need to run the business daily. Be it the temperature of refrigerators to the revenue required to make a profit.
This data already exists in various applications or spreadsheets. Where a KPI tool excels is the ability to pull all of your metrics and measures together in one place, giving you a snapshot of performance in real-time.

A simple task to begin identifying your KPIs is to take a single business entity; let’s use sales, for instance. From this business function, identify five metrics generally associated with sales. For our example, we could use the steps in the sales process for our basic metrics:
- The number of Calls this period
- The number of Leads this Period
- The number of Appointments
- The number of Sales
- The Sales value
With these base metrics identified, we can create more relevant performance indicators such as:
- Calls to Leads Conversion Rates
- Appointments to sales conversion rates
- Average Sales Value
These KPIs focus on the overall sales performance and not just on the number of calls, as this is by no means an accurate reflection of a salesperson’s performance.
Tip: You can find a selection of sales related KPI examples from the library here.
You will already have your business units defined within your organization, such as Sales, Marketing, Customer Support, Logistics etc. – so to get started, select 5 to 8 relevant KPIs for each unit.
Once selected, you will need to decide what frequency you’d like to report on the data. Will you measure them monthly, quarterly, or annually? – it is suggested that starting with monthly is a good balance between monitoring too much and having enough data to see trends and opportunities.
More Reading:
Using KPI Templates
Although it’s not recommended to use off the shelf KPI templates (as each business has its own way of working and personality), they can be a good source of inspiration to see how other companies track their KPIs, or they may highlight a new way of seeing your performance management that might be of benefit.
SimpleKPI comes with a set of example templates for you to use and explore.
Tip: You can also access these templates within the application on the KPIs tab.
Adding your KPIs to SimpleKPI
Once you have defined your KPIs, it’s time to get them into SimpleKPI. There are a couple of options for this depending on the quantity of KPIs:
- Enter your KPIs manually
- Upload a spreadsheet
Entering your KPIs Manually
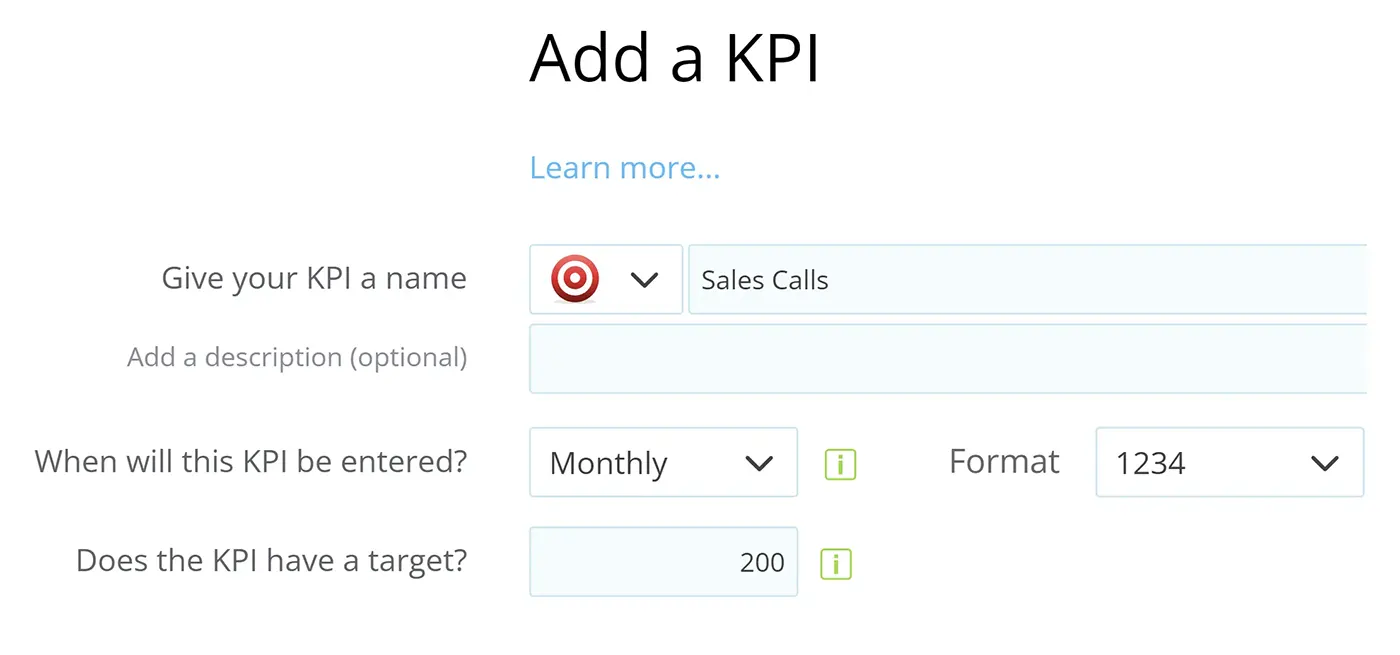
For small teams and departments, entering your KPIs manually is a straightforward process. Within the app, head over to the KPIs tab and click the ‘Add a KPI’ button.
You will see that there are several primary inputs you’ll need to create your first KPI. Essentially, a KPI is made up of 4 elements:
- What the KPI should be called.
- When the data will be entered, also known as the KPI frequency.
- The format, such as currency, percentage, or dates.
- The Target (if it has one).
In our sales example, you would use the following information:
Name: Sales Calls
Frequency: Monthly
Format: 1234
Target: 200
More on entering KPIs manually and the advanced options available can be found here.
Uploading a Spreadsheet
For ease of use and if you have lots of KPIs across departments, it’s best to use the import facility, for this you’ll need the KPI template; you can find this by going to the KPI tab and clicking on the upload button – here, you will be presented with a template to download.
Once you have the template, you can use this to enter the information in each column like so:
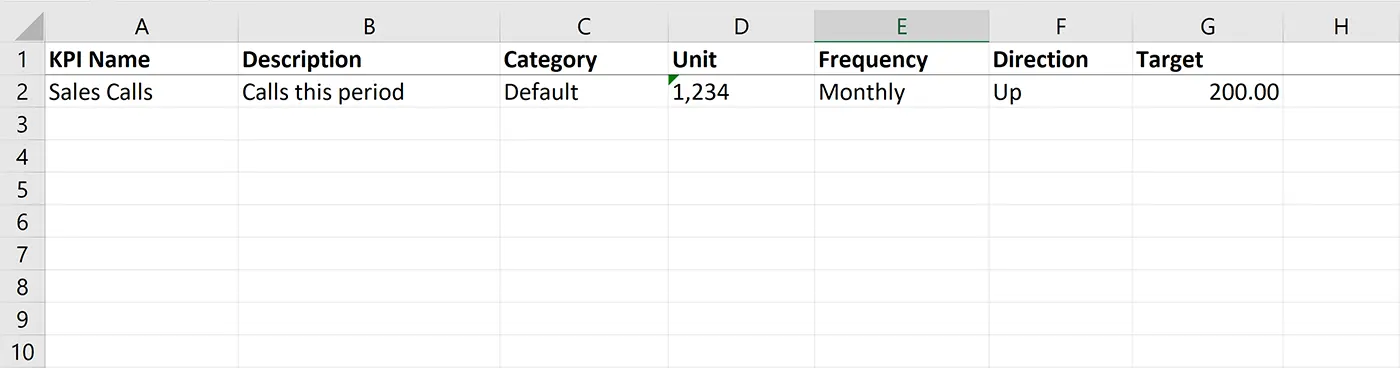
Once you’re done simply upload your KPIs to the system.
Setting up Users, Departments, or Teams
Whether you have a hierarchical or flat organizational structure, you will still need to configure your departments, teams, locations, and users to get the best from your KPI Reporting.
The good news is that it’s easy to do in Simple KPI, and a lot of it is automated for you.
Let’s take a basic grouping like office locations. Once you have these created in the app, drop each user into the relevant office, and SimpleKPI handles all the amalgamation of data and reporting filters.
To do this, head over to the ‘Groups’ settings.
Locations, Teams, and just about anything can go into groups – for example; you could create a grouping for nightshift and dayshift users if required. To create a new grouping, enter a group name and the group items. For example, offices would be the grouping and the group item would be ‘New York’.
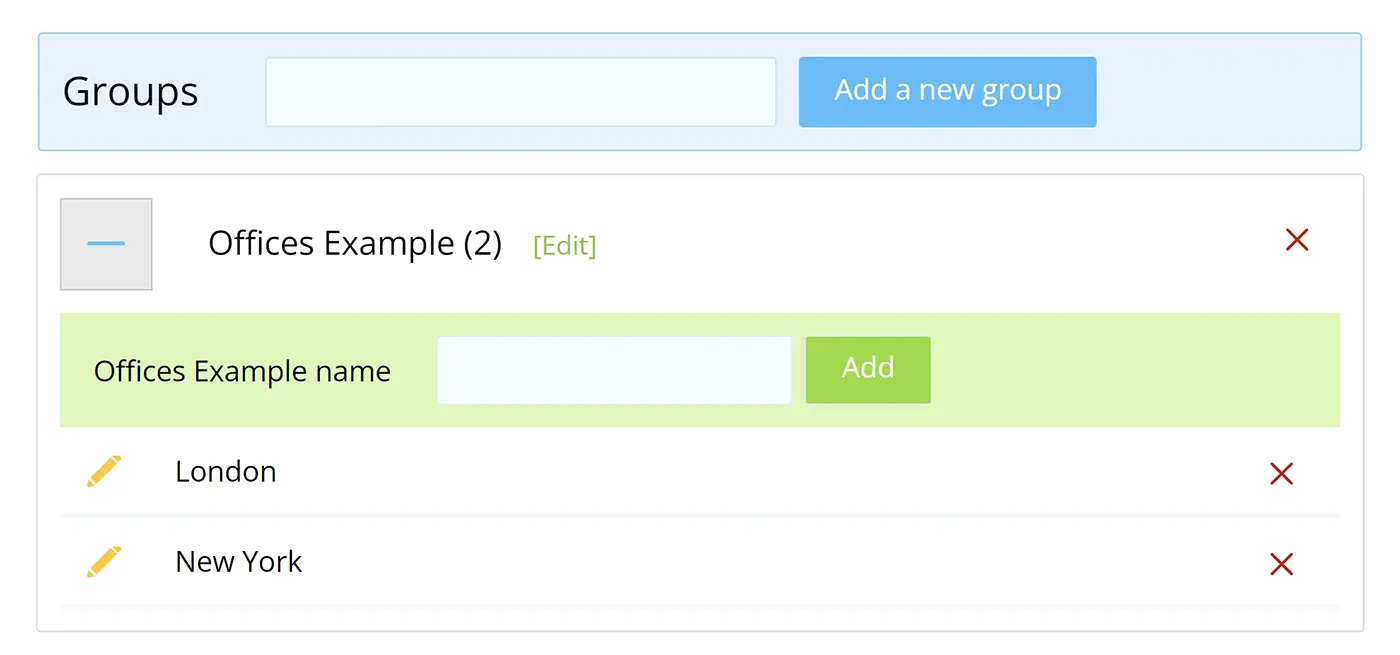
Once set up, any user that is assigned to the group will come under the reporting for that item. So, when you are ready to start building Reports and Dashboards you can choose to filter your results by users, locations, or for the entire company. More on setting up groups can be found here.
Connecting your data
The data that makes up KPIs can come from a near-endless number of sources, from simple paper tracking, automated software to social media.
It makes sense to automate as much of the data as you can for the KPIs you’ve identified to track. However, in some instances, manually entering data can also be part of the performance process.
Encouraging staff to manage and analyze their performance data can have a positive impact on efficiency.
Data Connections in SimpleKPI can be made in various ways to address most data situations:
Manually Entering Data
Once you create a KPI and assign this to a user, data can be entered through the data entry tab.
Uploading a data file
You can choose to upload your data via a Spreadsheet.
Emailing a spreadsheet
By setting up a KPI template, you can email this to your unique SimpleKPI data email, where the data will be extracted into the system automatically.
Linking to a Google Sheet
You can set up a Google sheet to enter your data and automatically have that data sent to SimpleKPI to create Dashboards and Reports.
Integrating with other applications
Online apps now manage various aspects of many businesses; you can choose to integrate the data they produce into your SimpleKPI account. Either through SimpleKPI native data integrations or using Zapier to create a connection.
API
For more advanced data integrations, you can develop your own gateways between internal servers and applications to send and pull data from SimpleKPI.
Visualizing your KPIs on Dashboards
Graphs and charts can provide us mere mortals with the ability to see trends and come to conclusions way faster than looking at a long list of numbers. The benefits of KPI dashboards are that you can group various charts to see a complete picture of performance across an organization or department at a glance.
When creating your first dashboard, a bit of forward planning will make the process go far smoother. We like to build our dashboards to tell stories using the data, almost as if we were creating an elevator pitch of the most important metrics with a start, middle, and conclusion.
To create your first dashboard, consider the following:
- Who is the audience? Are they looking at lagging data or need real-time data for their day-to-day duties?
- What would be a logical start and endpoint for this audience?
- Choose chart types that would visualize the data in the most precise possible way.
- Organize the dashboard charts so that the charts are both in a logical order and/or support the data in a neighboring chart.
- Once you have a plan in place, you can start getting the charts and graphs onto your dashboard.
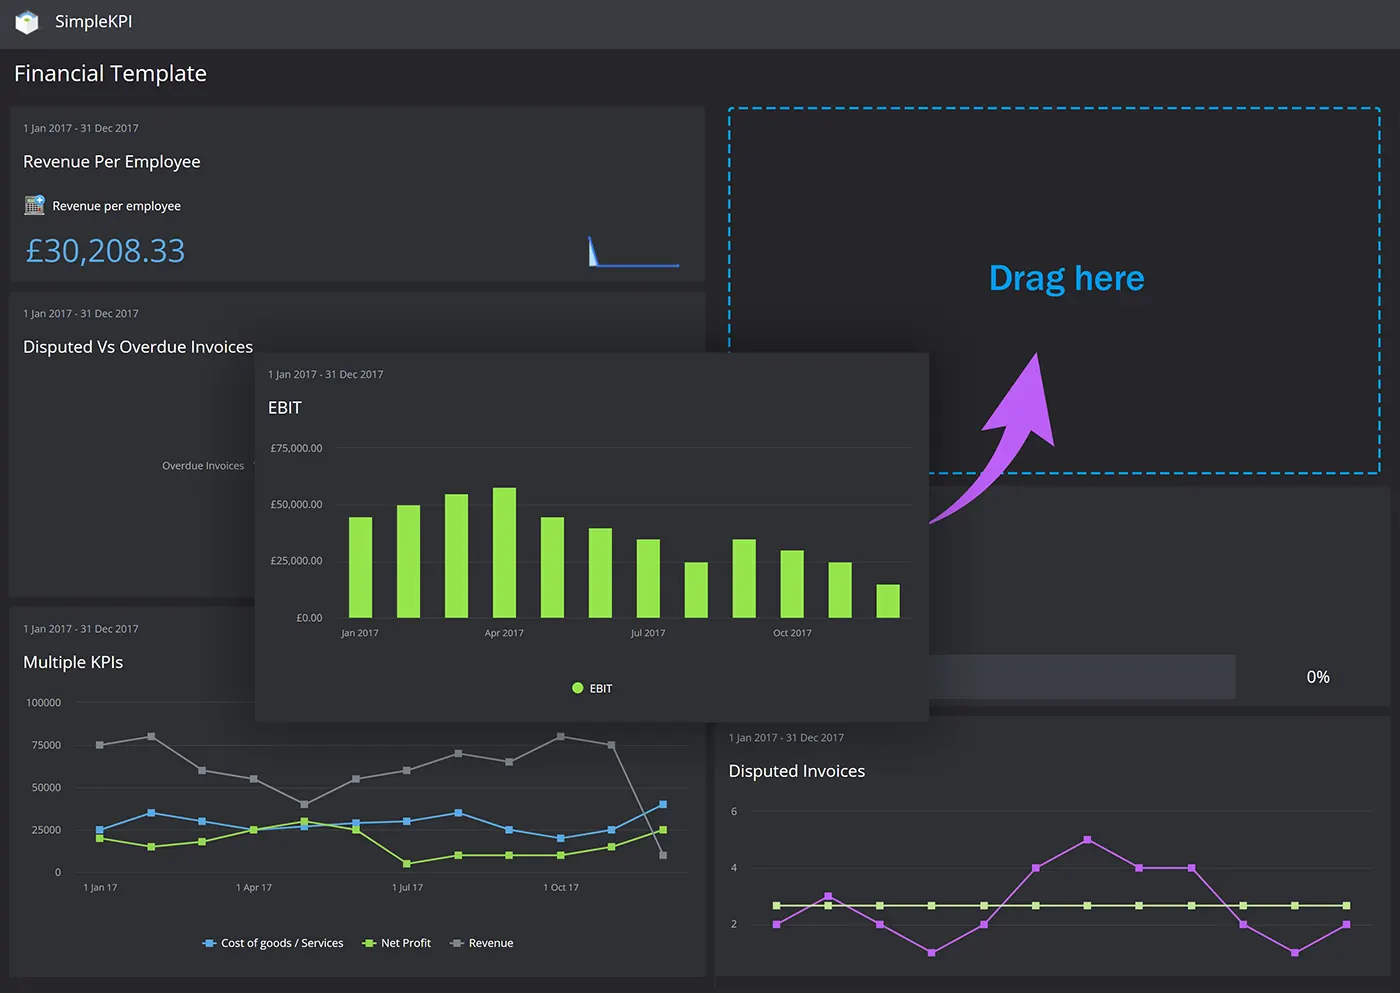
Adding your charts
Head over to the Dashboard tab and click the ‘Add a Chart’ button. From here, you will be able to select various widgets to support your data visualizations. There is a nearly endless number of options concerning colours, filters, and options you could need for your charts.
Once you have built your first chart, you can add these to your dashboard and then position them by dragging the chart component to other areas of the grid.
Visualising Your KPIs on Reports
KPI Reports differ from Dashboards in that they offer a less visual and more analytical view of the data. For example, when historical sales figures need to be analysed by products or sales reps then you need the actual numbers for a specified period, and not a line graph representing the number of sales.
One way to look at reports is that they should answer questions arising from the peaks and troughs in the data. Another is to use them to view more micro details at the strategic level to find answers to efficiency issues.
Like KPI Dashboards, reports need a little planning also. It’s best practise to try and group your reports into either Analytical, Strategic or Operational.
Creating KPI Reports in SimpleKPI can be achieved using the ‘Reports’ tab.
You will see several standard reports covering areas such as top-performing and Multiple KPIs, through to data-focused reports such as entries by the KPI or by a user.
These reports serve as a starting point for generating your own reports.
Once you have selected a report and customized it to your requirements, it can be saved, shared, or generated into PDFs.
Sharing your Reports
Both Reports and Dashboards are meaningless if they exist in isolation. There are times when a single dashboard my work for a single user but for most organizations, sharing provides a wealth of benefits:
- They can help generate solutions to common problems.
- They focus on getting the correct information to the right people.
- Generate efficiencies in production.
- They provide a platform to explore opportunities.
With this in mind, you can share Reports and Dashboards either with individual users or a group of users, teams, departments or even make them publicly accessible via your unique link.
Wrapping up
If you are new to KPI tracking, then we hope this guide has provided a helpful guide to get up and running with your performance tracking.
KPI Software is not only a convenient way to track and visualize your KPIs, but with a bit of planning and the right software, you can benefit from the insights hidden in your data. Performance can be managed more efficiently, and goals and targets can be realized with more transparency and accountability.
We’d love to hear about any tips, issues, and suggestions you have, so please drop us an email at info@simplekpi.com.

by Stuart Kinsey
Stuart Kinsey writes on Key Performance Indicators, Dashboards, Marketing, and Business Strategy. He is a co-founder of SimpleKPI and has worked in creative and analytical services for over 25 years. He believes embracing KPIs and visualizing performance is essential for any organization to thrive and grow.