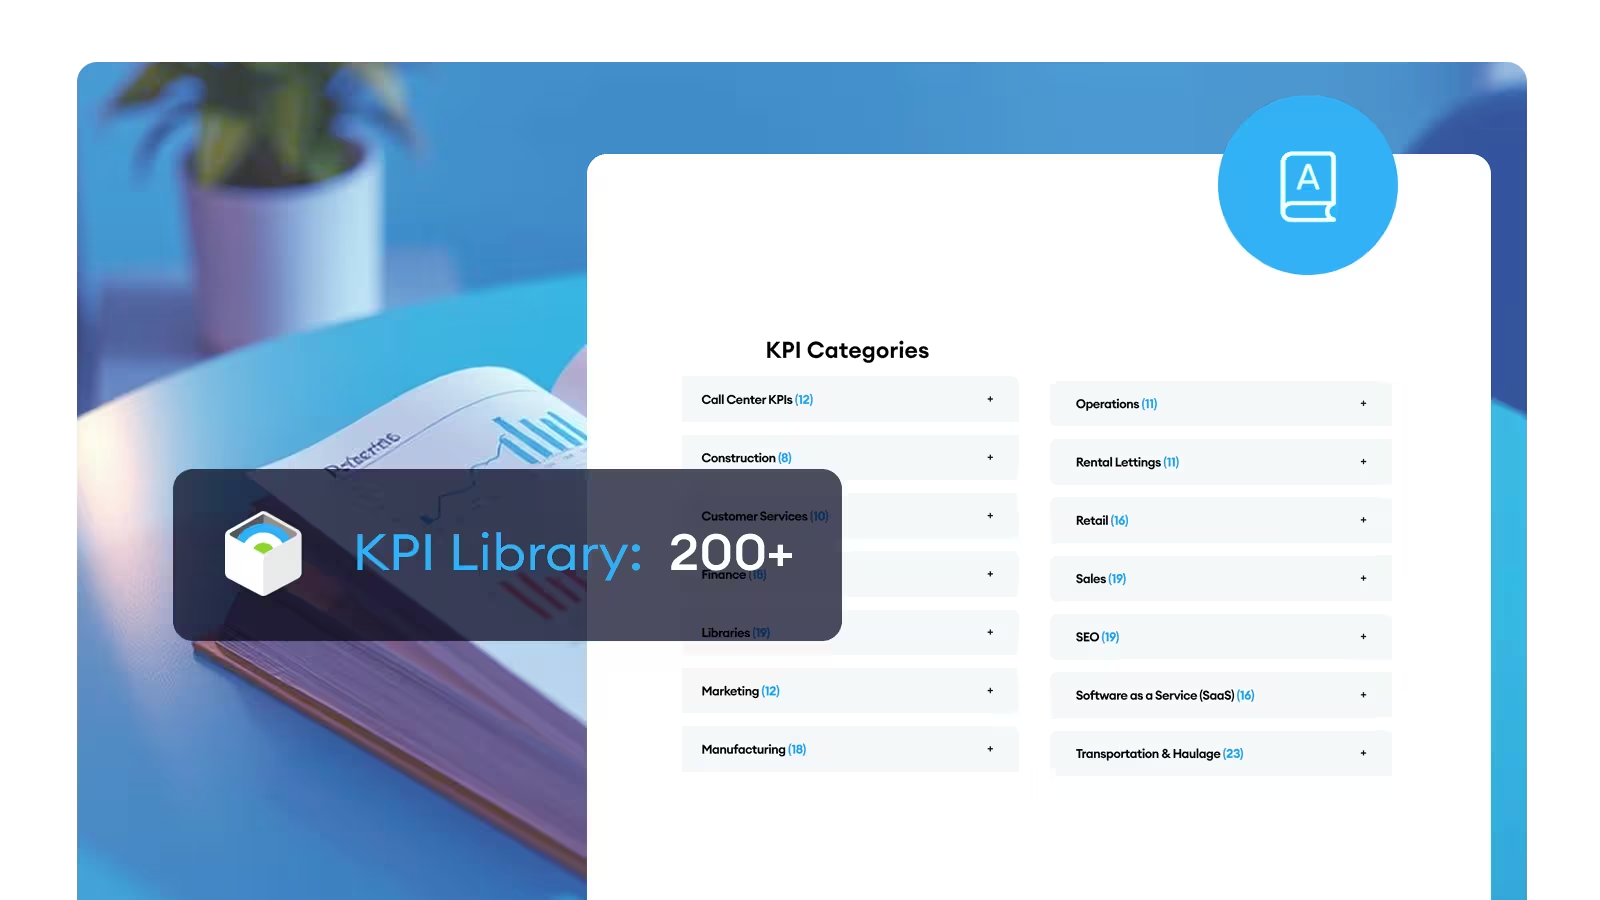
Browse the KPI Library
Welcome to the KPI Library, where you'll discover a wide array of industry-focused KPIs designed to kickstart your performance monitoring. From Call Center KPIs to Transportation metrics and everything in between, we've got you covered.
Each KPI is crafted and tested by industry experts, following best practices in performance management.
You can also find these KPIs and templates directly in your SimpleKPI account under the KPIs tab. We're always eager to expand our library, so if you have suggestions for new KPIs or categories, we'd love to hear from you.
KPI Categories
Abandoned Calls
The total number of abandoned calls
Agent Days Worked
The number of agent days worked this month
Average Wait Time
The number of seconds a caller has to wait
Call Center Expenses
Total expenses for the call center
Call Conversions
The number of calls converted to sales
Call Handle Time
The average length of customers calls and associated tasks
Cost Per Call
The number of calls divided by the call center expenses
Customer Satisfaction
Customer Satisfaction Percentage
First Call Resolution
The number of resolutions completed on first call
Inbound Calls
The total number of answered and unanswered calls
Service Level
The number of inbound calls answered within 30 seconds
Total Answered Calls
The number of calls answered
Construction Hours to date
The total amount of construction hours to date
Construction schedule variance
The construction schedule variance
Cost Per Km / Mile
The cost of 1km or mile of construction
Defect rework cost
The total cost of fixing defects
Defects Found
The number of defects found by the client
Projected Construction hours
The projected construction hours
Safety: Reportable Incidents
The total number of reportable safety incidents this period
Square Meter Cost
The cost of construction for a Square Meter
Complaint Percentage
The percentage of complaints received
Complaint resolution time
The time taken to resolve a customer complaint
Customer Complaints: Verbal
The number of verbal customer complaints
Customer Complaints: Written
The number of written customer complaints
Overdue Service Requests
The percentage of overdue service requests or queries
Positive feedback
The number of positive comments and feedback
Satisfaction Surveys
The number of customers or clients given a satisfaction survey
Satisfied Customers
The percentage of satisfied customers this period
Service Desk Costs
The operating costs of the service desk
Warranty Claims
The number of warranty claims this period
Consulting Revenue
Revenue from financial consulting
Cost of goods / Services
Inventory costs of goods or services sold
Daily Cash
Combined Cash Balance
Disputed Invoices
The percentage of disputed invoices
EBIT
Earnings before interest and taxes.
Financial Reporting Accuracy
The percentage of accurate reports produced each month
Gross Profit Margin
Difference between revenue and cost before accounting for other costs.
Margin
The total Margin
Net Assets
The total Net Assets
Net Profit
The measure of profitability after accounting for all costs
Net Profit Margin
Percentage comparing net profit after taxes to revenue
Number of Employees
The number of employees
Order entry
Daily order entry
Outstanding invoice amount
Settlement of Outstanding Invoices
Overdue Invoices
The number of invoices that are overdue
Revenue
Income received from business activities
Revenue per employee
Revenue by the total number of work force
Working Capital
Current assets minus current liabilities
Cost Per Search
Cost per search
Customer Satisfaction average
The customer satisfaction average
Customer satisfaction completions
The number of visitors completing a satisfaction survey
EBooks
The total number of Electronic EBooks used
Electronic Expenditure
Expenditure on electronic resources, e-journals, databases
Electronic Journal Downloads
The total number of electronic downloads
Electronic resources expenditure %
Electronic expenditure % of total expenditure
Info Expenditure %
Info expenditure % of total expenditure
Information Expenditure
Expenditure on information, books, journals etc.
Items Loaned
The total number of items loaned
Items loaned per visitor
Average number of items loaned per visitor
Library Expenditure
Total library expenditure
Library expenditure per Visitor
Average spend per unique visitor
Number of Searches
The number of information searches
Occupancy
The percentage occupancy of the premises
Staffing Expenditure
Staffing costs
Total Visitors
The total number of visitors
Unique Visitors
Unique Visitors
Viewings to let ratio
Percentage of viewings to tenancies
Marketing Spend
Total spend including internal and external costs
Budget Remaining
Expenses versus budget year to date
Inbound Leads
The total number of generated inbound leads across all channels
Unique website visitors
The unique website visitors this period
Social Reach: FB followers
The total number of new followers this period
Social Reach: Twitter Followers
The total number of new followers this period
Social Reach: LinkedIn Followers
The total number of new followers this period
Social Reach: Instagram Followers
The total number of new followers this period
Advertising Response Rate
The total number of new followers this period
Net Promoter Score
Customer Loyalty
Cost per lead
The average cost for each inbound lead
Visitor to conversion
The percentage of visitors who complete a given goal
Actual Production Cost
The actual cost of production
Actual Production Time
The actual product time
Availability OEE
The Actual production time / Potential production time
Average cycle time – ACT
Time from the order to the delivery of final ordered product
Cycle Time Ratio – CTR
CTR Standard cycle time / the real cycle time
Labor cost per unit
Total labor costs / number of units manufactured this period
Labor Costs
Labor Costs this period
Number of Days
Number of days units are in the production process uncompleted
Number of units unfinished
The amount of unfinished units in the production process
Potential Production Time
The total potential production time
Production cost variance
PCV - Actual production cost / standard production cost
Production losses
The number of finished products / overall production
Real Cycle Time
The Real Cycle Time
Standard Cycle Time
The Standard Cycle Time
Standard Production Cost
The standard cost of production
Units Manufactured
Units manufactured this period
Units on time
The number of units finished on time
Value of work in progress
The Value of units that are in the production process
Actual Productive Time
The actual productive time of the machine or plant
Carbon Footprint
The carbon usage this period in Tonnes
Down Time Percentage
The calculated percentage downtime of the machine or plant
Planned Productive Time
The planned Productive time of the machine or plant
Product Recycling Rate
The percentage of the product that is recycled
Supplier Performance Score
The total supplier performance score
Supply Chain Miles
Product location to final delivery in miles
Total Waste Created
The total volume of waste created this period
Waste Recycled
The volume of waste recycled this period
Waste Recycling Rate
The percentage of waste that is recycled
Wasted Material
The wasted raw material this period
Actively let properties
The number of actively let properties
Average property letting time
The average time taken to let a new property
Average tenure of property
Average tenure per property over a 12 month period
Early termination
The number of early terminations
Property manager properties
Average number of properties managed per property manager
Property Viewings
Viewings on a property before a successful tenancy agreement
Registered / Actively looking
The number of registered people looking for properties
Re-letting time
The average number of weeks taken to re-let a property
Rent Arrears Evictions
Percent of tenants evicted as a result of rent arrears
Reported Defects
The number of defects reported per month
Seeking Possession Served
The number of possession orders served
Average Basket Spend
The average amount spent per transaction
Average Shopping Time
The average shopping time for the period
Cost of Goods
The retail price minus the markup = Cost of Goods
Customer Retention
The number of repeat customers compared to first time purchasers
Fixed Cost Per period
The total cost of opening for the period
Gross Margin
Total sales minus the cost of goods
Gross Sales
The total value of all sales
Net Sales
Gross Sales - Returns and Allowances
Offline Sales
Offline Sales / In-Store
Online Purchases
Online purchases
Online Vs In-store purchases
The percentage of online to store purchases
Retail Price
The total cost of Goods plus the markup
Returns & Allowances
The values of Returns & Allowances
Shop Visitors
the number of visits
Transaction Count
The amount of transactions
Visitor buying Ratio
Visitors buying ratio
Attempted 'Up Sales'
The number of attempted 'Up Sales' by unit
Average Sale Revenue
The average revenue per sale
Closing efficiency
Number of quotes to closed sales
Cost of Sales Force
The cost of the sales force
Face to Face visits
The number of face to face customer visits
New Sales Percentage
New versus repeat sales percentage
New Sales Revenue
Sales Revenue From New Customers
Number of Sales
The number of sales by unit
Opportunities
The number of opportunities / leads /contacts
Proposals Issued
Number of proposal issued
Proposals lost
No. of lost proposals.
Prospect Meetings
The number of prospect meetings
Quotes
The number of quotes by unit
Repeat Sales Revenue
Sales Revenue from Repeat Customers
Sales Pipeline Value
The current value of sales opportunities
Sales Revenue
Sales revenue for this period
Successful 'Up sales'
Number of successful 'Up Sales' by unit
Up-selling Success Rate
The percentage of successful up-selling attempts
Value of Quotes
The Value of Quotes this period
Average site time
The average visitor time on the website
Blog Posts
The number of blog posts this period
Bounce Rate
The bounce rate this week
Case Studies
The number of case studies this period
Clicks from Google
The number of clicks from Google
Goal Conversion Rate
The percentage of visitors to a site that have completed a set action or goal
Google impressions
The number of Google impressions this week
Inbound Links
The number of inbound links to your website
Keyword position
The position of searched keyword
Natural Search Traffic
The number of visits coming from natural searches
OSOV - Online Share of Voice
The ratio of positive, negative and neutral comment about your product, service or company
PPC Traffic
The number of visitors from PPC
Press Release
The number of press releases this period
Returning visitors
No. of Returning Visitors to your website
SMM Post Activity
The number of posts, blogs or tweets this period
Tweets
The number of tweets this period
Unique website visitors
The total number of unique visitors this period
Webinars this period
The number of webinars produced this period
White Papers
The number of white papers produced and distributed this period
Active accounts
The total number of active / paid accounts
Bugs Reported
The number of bugs reported this period
Canceled Demos / Webinars
The number of canceled demos / webinars this period
Converted Trials
The number of trials converted into paid accounts
Cost per paid account
The total cost of obtaining a new account
Cost per trial
The cost per trial
Demo Requests
The number of demo requests
Live Demo / Webinar completion
The number of live demos / Webinars completed this period
Multiple Logins
The amount of users that login more than once
New Data import
The number of accounts that have added their own data
New Trial Accounts
The number of new trial accounts
Online Marketing Spend
The total cost of online marketing this period
Releases
The number of releases this period
Trial Conversion Percentage
The percentage of trials converted into paid accounts
Visitor / Trial Percentage
The number of visitors that convert into new trials
Webinar / Demo success
The number of Demos / Webinars into paid accounts
Average ETA
The average estimate time of arrival
Booked future pickups
The number of pickups booked for a future date
Canceled Pickup / Orders
The number of pickups or orders canceled
Damage Rate
The damage percentage of total deliveries
Delivered On time %
% of orders delivered on time
Deliveries
Total Deliveries for the period
Drivers Absent
The number of drivers currently absent
Fleet Costs
Total running costs per vehicle (new fleet)
Incorrect or No Paperwork
Incorrect or no paperwork
Late deliveries
The number of deliveries arriving outside the time slot
Number of Drivers Available
The total number of drivers available for the period
On Time Deliveries
Number of Deliveries completed on time
On-site damage
Damages discovered after unloading delivery
Operating Vehicles
The # of vehicles operating in this period
Pre-loading Damage
Damage found prior to loading
Premium pickups / orders
The number of premium pickups or orders
Routed Distance
The total Kms or Miles in a direct route
Routed Hours
Total hours in a direct route
Total Pickups / Orders
The total number of pickups or orders per day
Transit Damage
Damage discovered before unloading after transit
Unable to deliver
The number of deliveries unable to be fulfilled
Warehouse Space
Space left in the warehouse Msq
Wrong Delivery details
The number of incorrect delivery details
Introduction
Welcome to SimpleKPI's KPI Library – your go-to resource for a comprehensive collection of Key Performance Indicators (KPIs) tailored to various industries. Whether you're in finance, marketing, customer service, or manufacturing, our library offers industry-tested KPIs to jumpstart your performance tracking and management efforts.
Selecting KPIs from a Library
Choosing the right KPIs is critical to effective performance management. In our KPI Library, each KPI is carefully categorized by industry and business function, making it easy to find relevant metrics for your needs. By selecting KPIs that align with your specific objectives, you can ensure that your tracking focuses on what truly matters to your business.
Using the KPI Library within the SimpleKPI App
The KPIs listed in this library can be directly accessed within the SimpleKPI application. Simply navigate to the "KPIs" tab in your account to browse, select, and apply these KPIs to your dashboards and reports. This seamless integration allows you to start tracking performance immediately without the need for manual setup. Then you are able to incorporate these KPIs in your Dashboards and reports.
Benefits of Using the KPI Library
- Expert-Validated KPIs: Each KPI is designed and tested by industry experts.
- Ease of Use: Instantly integrate KPIs into your SimpleKPI account.
- Comprehensive Coverage: Find KPIs across a broad range of industries and business functions.
- Time-Saving: Quickly identify and apply the most relevant KPIs to your business.
Yes, all the KPIs listed in the SimpleKPI Library are free to use.
If you can't find the KPIs you need, consider using our KPI Generator to create custom metrics tailored to your specific needs.
A KPI Library is an excellent starting point for businesses looking to standardize their performance metrics. It offers a wide range of ready-made KPIs that can be easily adapted to various industries and business models.