In this Article:
- Introduction
- What is a KPI Dashboard?
- Three KPI Dashboard Types
- What is a Strategic KPI Dashboard?
- What is an Operational KPI Dashboard?
- What is a Financial KPI Dashboard?
- Conclusion
Introduction
In an ideal KPI world, every business would operate using a single KPI dashboard.
Data would seamlessly flow without human oversight. Charts and graphs would automatically adjust to display only the information needed to achieve a goal. And working out which user needs that data to achieve the desired outcome in the shortest time
Understandably, the idea that business decisions are removed from the hands of their very owners is not likely to gain much traction in the short term.
So in the meantime, we need to make the process of creating, managing, and analyzing KPIs in the most efficient way possible - in a way that allows us to reap the benefits of using dashboards without overcomplicating the process. Luckily, the answer to this is by segmenting dashboards by function/purpose.
In the following article, we will discuss the three main KPI dashboard types and how they are used.
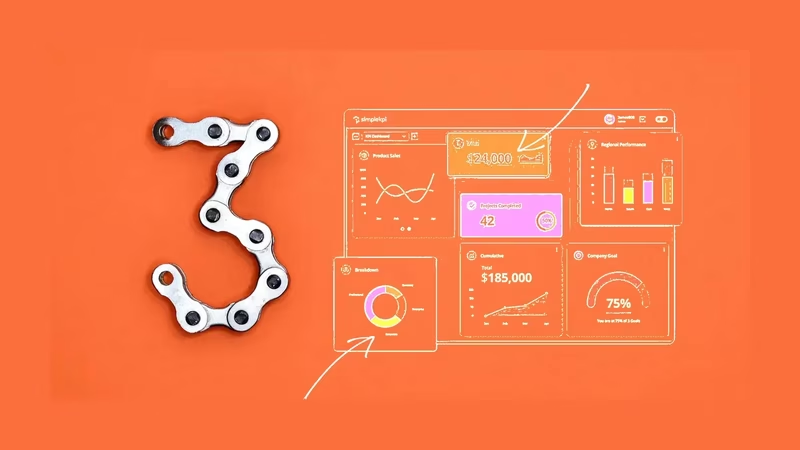
What is a KPI Dashboard?
A KPI dashboard presents Key Performance indicators in graphs, charts, and tables. They provide a quick, interactive, and systematic way to review and analyze KPIs. Typically a KPI Dashboard will visualize data from multiple sources to uncover insights and promote data-driven decisions. Organizations then benefit from seeing performance against predetermined objectives.
Dashboards are now widely accepted amongst growing businesses as a fundamental part of their growth strategy.
Three KPI Dashboard Types
It's always tempting to adopt a one-stop approach to KPI dashboards, and many companies begin by creating a single dashboard that covers all aspects of the business.
It can be desirable for smaller companies or teams with a focused objective. However, opting for a single dashboard can be fraught with challenges that derail any perceived gains or benefits.
For a more efficient approach to KPI dashboard management, companies segment their dashboards into primary functions.
These dashboard types range from Analytical to Operational and can also be industry-focused. However, the three primary dashboard types that cover most business and industry types are:
- Strategic: Where do I want to be?
- Operations: What is happening Now?
- Financial: How are my finances?
What is a Strategic KPI Dashboard?
A Strategic KPI Dashboard is a management performance tool used to monitor the progress of goals within an organization's overall strategy. Complex data sets are translated and then displayed as easy-to-understand Charts and Graphs.
Company owners and senior management use these dashboards to gain insights and adjust their organization's strategy accordingly.
The benefits of a Strategic KPI Dashboard
The single most apparent benefit of Strategic KPI dashboards is that they provide a mechanism to measure performance that is data-driven and does not rely on guesswork.
However, they also provide an organization with additional benefits in support of their strategic aims, such as:
- Reducing the time it takes to evaluate the progress of strategic business aims.
- Improving strategic decision-making.
- Providing a consistent approach to strategic performance measurement.
- Enhancing efficiency across all decision-makers regarding strategic goals.
- Real-time analysis of data inconsistencies affecting strategic goals.
- Forecasting that's based on historical and seasonal trends to evaluate potential performance.
Strategic KPI Dashboard Examples
By their very nature, Strategic goals are personal to each organization. Even subtle differences such as focusing on growth or market share can provide a vast gap in the graphs and charts used to measure this progress.
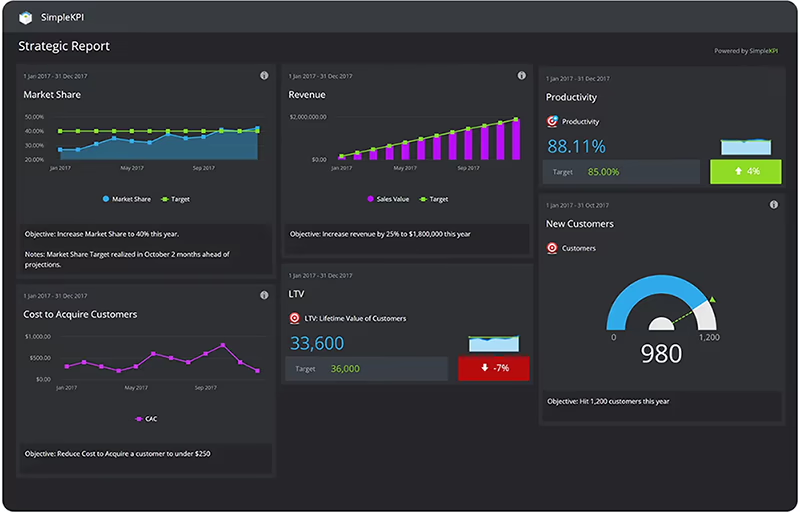
For example, a strategic KPI dashboard focused on growth may use KPIs targeting the number of new sign-ups or customers as a rolling total. In contrast, market share may focus on KPIs that cover Social Media mentions.
Typically, in Strategic dashboards, you may see the following types of KPIs, charts, and graphs:
- Audience and user growth
- Repeat customer ratios
- Turnaround Times
- Staff Turnover Rates
- Support Times
What is an Operational KPI Dashboard?
An operational KPI Dashboard is a real-time performance management and visualization tool. They are commonly used in manufacturing to track the performance of processes, machinery, and production lines to operators and managers. The performance data from those processes are displayed in charts and graphs. Deviations in normal operations can be investigated and actioned without collating data after the event.
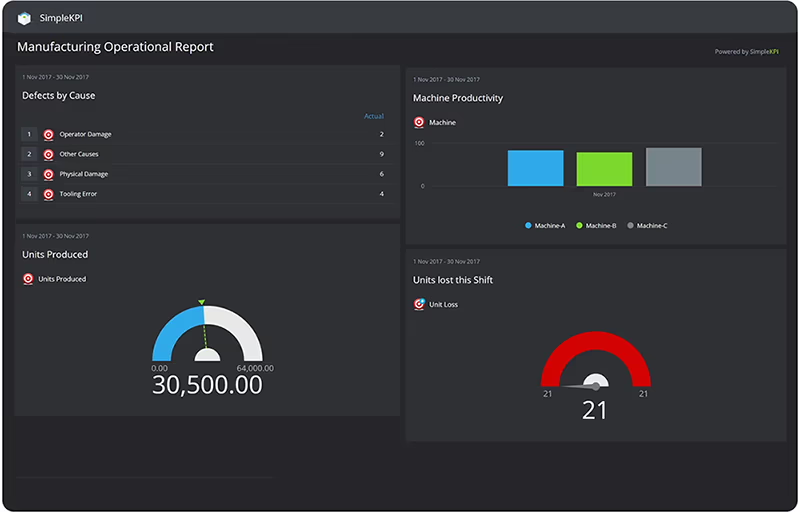
Additionally, operators and managers can glean important trend information over time that can enable them to tweak and refine processes.
The benefits of an Operational KPI Dashboard
Operational KPI dashboards can keep the pulse of daily operations to evaluate the health and efficiency of an organization's day to day activities. As well as this primary benefit, they also provide:
- An easy to use and understand platform for monitoring performance.
- Offer a trusted mechanism for implementing efficiency gains.
- A consistent version of operating performance.
- Root cause analysis of performance dips and peaks.
Operational KPI Dashboard Examples
Although operational dashboards lend themselves natively to manufacturing and production lines, they are also used extensively in other industries to track day-to-day operations.
For example, an operational KPI Dashboard focused on the daily staff resourcing for a fitness center can help determine the operating temperatures of pools or that cleaning schedules are being maintained.
Operational dashboards will contain KPIs focused on daily activities, and the data is most commonly present in real-time such as:
- Number of units produced
- Operating temperatures
- Average turnaround times
- Defects or damages
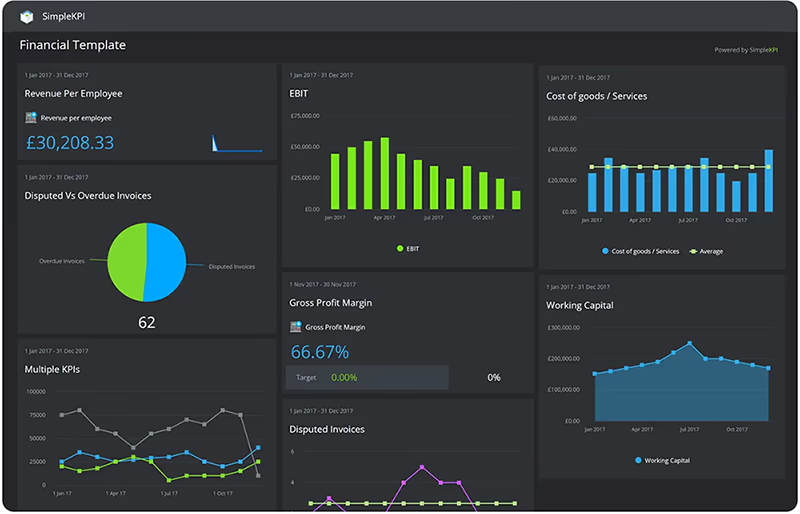
What is a Financial KPI Dashboard?
A financial KPI Dashboard is a type of data visualization tool that focuses on the financial health of an organization. It enables financial objectives such as increased turnover, reduced expenses, and profits to be tracked from a single source.
What are the benefits of a Financial KPI Dashboard?
Financial KPI Dashboards provide up-to-the-minute financial performance across the many cost-orientated areas of the business. Keeping on top of income and expenses is not the only benefit offered by these types of dashboards; they also provide:
- Up-to-date cash flow.
- Budget progress and evaluation.
- A consistent view of the organizations' finances.
- Root cause analysis of peaks and troughs in financial data.
Financial KPI Dashboard Examples
Financial dashboards are the most recognized and widely adopted of the three strategic KPI Dashboards. Not only do companies share most of these inherent KPIs, but they also share the same strategic aims.
These aims can be as simple as a small coffee shop tracking its revenue to a large multi-site production facility aiming to reduce costs.
The KPIs typically associated with these types of dashboards are:
- Revenue
- Expenses
- EBITDA
- Working Capital
- Sales Growth
- Profit Margin
Conclusion
Due to the very nature of dashboards and the unlimited possibilities they present, it can be tempting to overload them with too many graphs and charts.
This can lead to confusion, and at worst, it can present a distorted and delayed perception of an organization's performance.
But by segmenting dashboards by their function and audience, combined with some careful KPI selection, it is possible to streamline the process of creating dashboards.

by Stuart Kinsey
Stuart Kinsey writes on Key Performance Indicators, Dashboards, Marketing, and Business Strategy. He is a co-founder of SimpleKPI and has worked in creative and analytical services for over 25 years. He believes embracing KPIs and visualizing performance is essential for any organization to thrive and grow.