
I was first introduced to Benford’s Law as a throwaway fun fact at a birthday party. You know the kind—something shared between mouthfuls of hotdogs that makes you go, “Wait, what?” The idea was simple: in many naturally occurring datasets, the leading digits of numbers follow a predictable pattern. Whether it’s the populations of cities, the lengths of rivers, or even financial transactions, certain numbers show up more often than others, starting with 1 being the most popular, all the way down to 9.
At first, it sounded like one of those random trivia nuggets you’d forget by the end of the night.
But I mean, really. How could something like numbers, spread across so many unconnected contexts, possibly follow such a specific rule?
And more importantly, how could that be useful in the structured world of KPIs?
So, I’d like to share with you how Benford’s Law can also work when tracking sales performance, marketing metrics, or even your operational efficiency. And how this strange law can help you spot anomalies, validate data integrity, and make smarter business decisions.
What Is Benford’s Law?
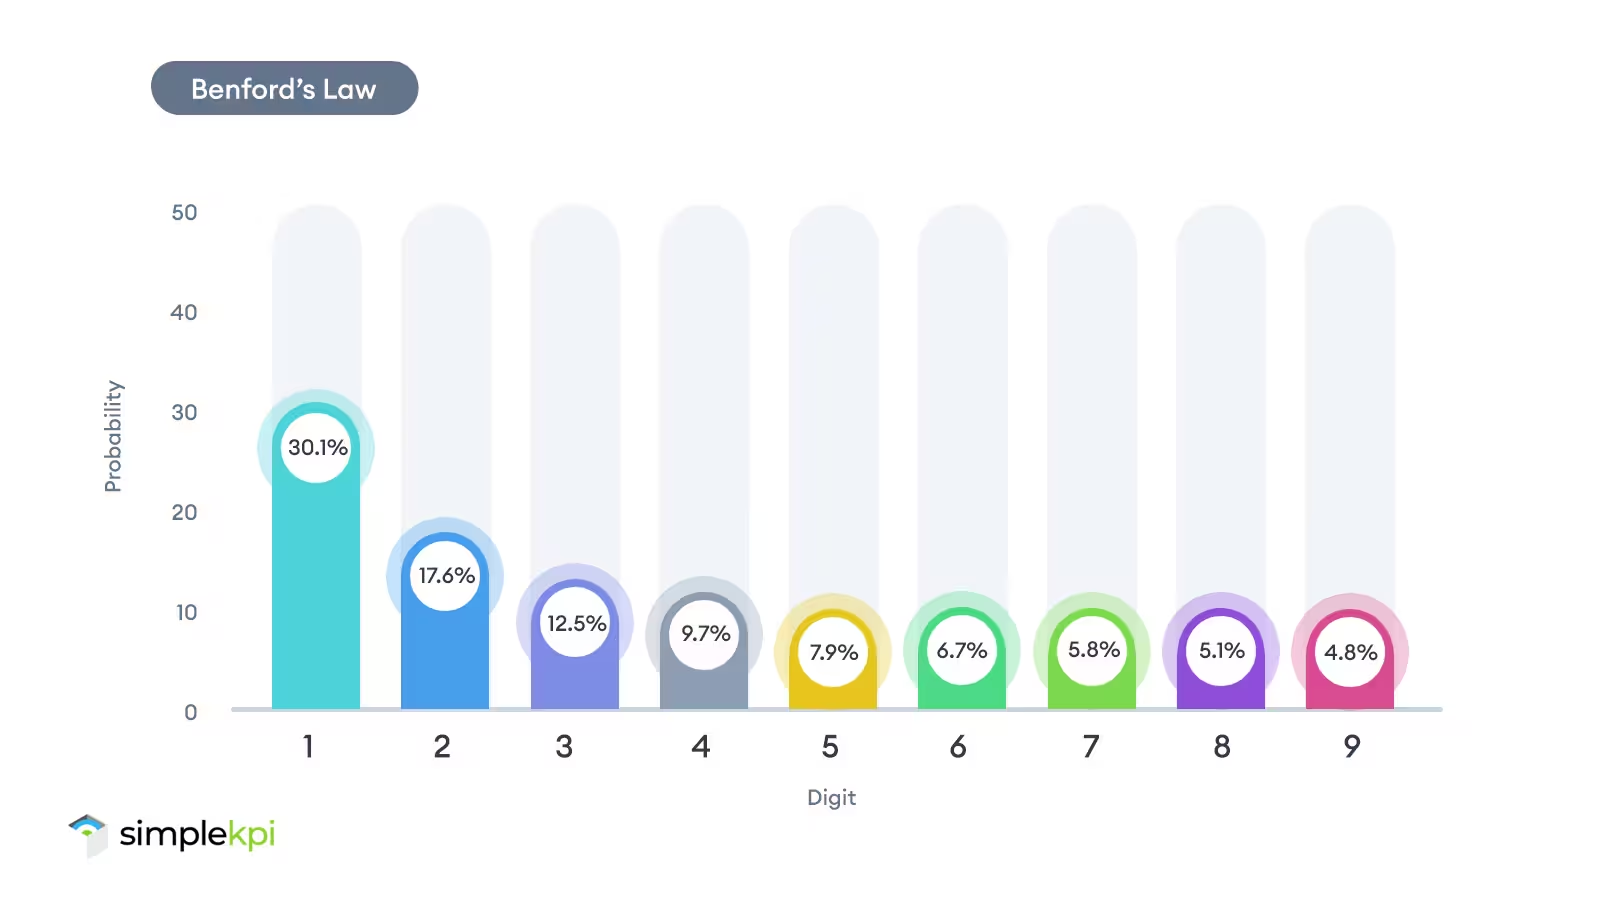
Okay, so I’ll try to break it down. Benford’s Law is one of those mathematical quirks that feels too weird to be true, but the more I looked into it, the more it seems to make sense. At its core, it’s a rule around numbers, specifically, the leading digits in datasets. You’d think that in any random collection of numbers, each digit (1 through 9) would have an equal chance of being the first.
But nope, that’s not what happens.
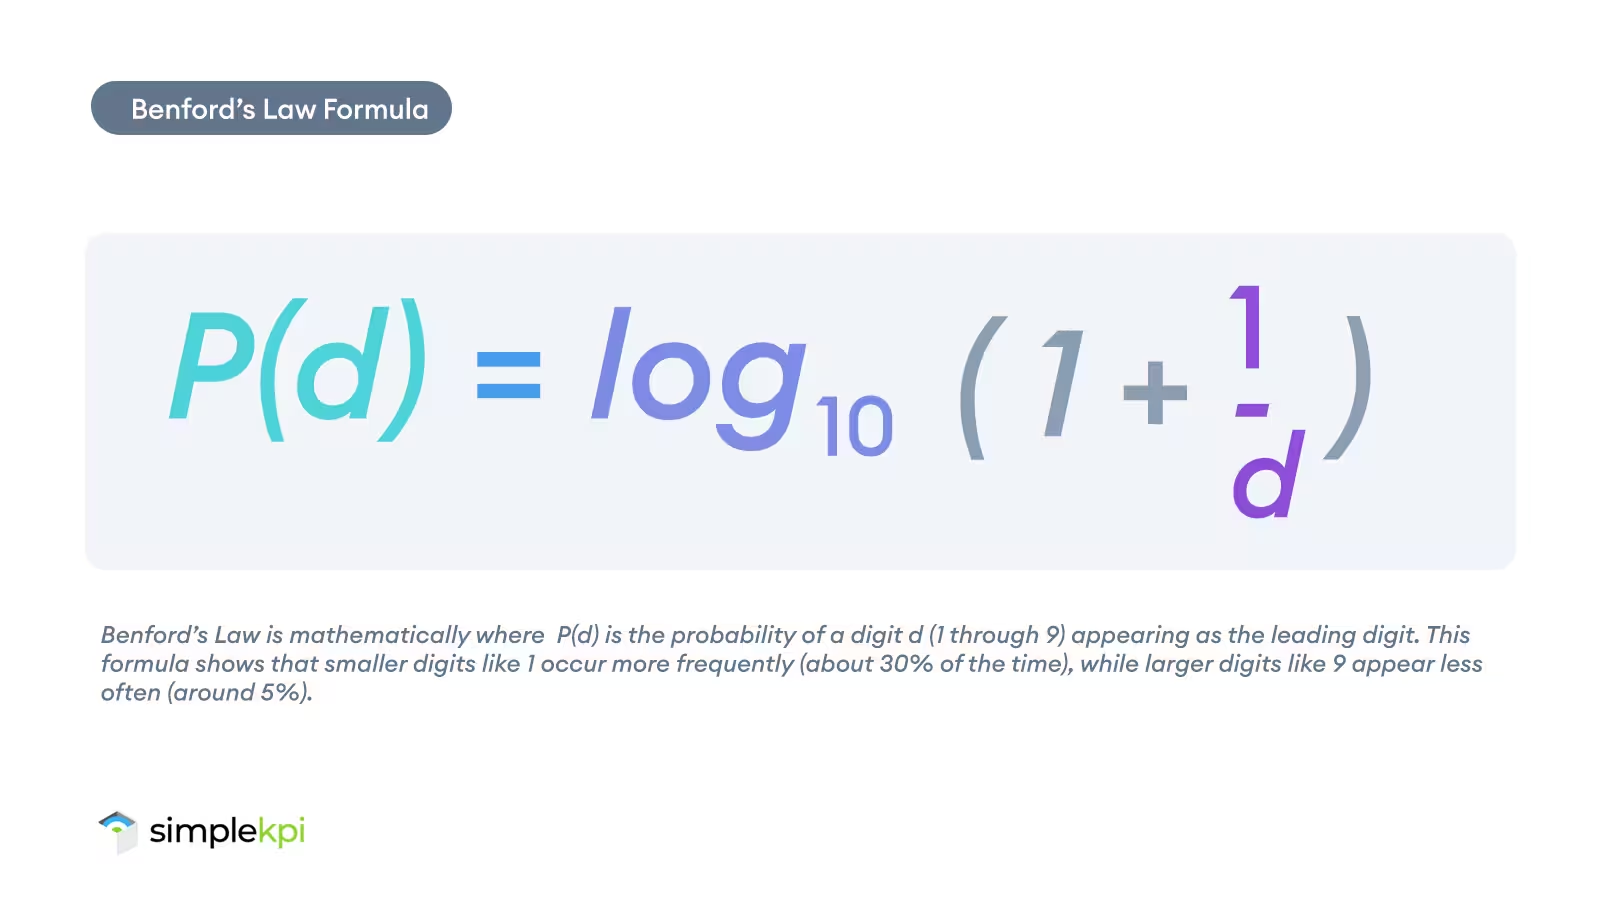
According to Benford’s Law, numbers starting with 1 show up way more often, roughly 30% of the time. Meanwhile, numbers starting with 9 only make an appearance less than 5% of the time. This pattern holds true across all kinds of naturally occurring data: populations of cities, stock prices, electricity bills, lengths of rivers, you name it.
So, what’s the big deal?
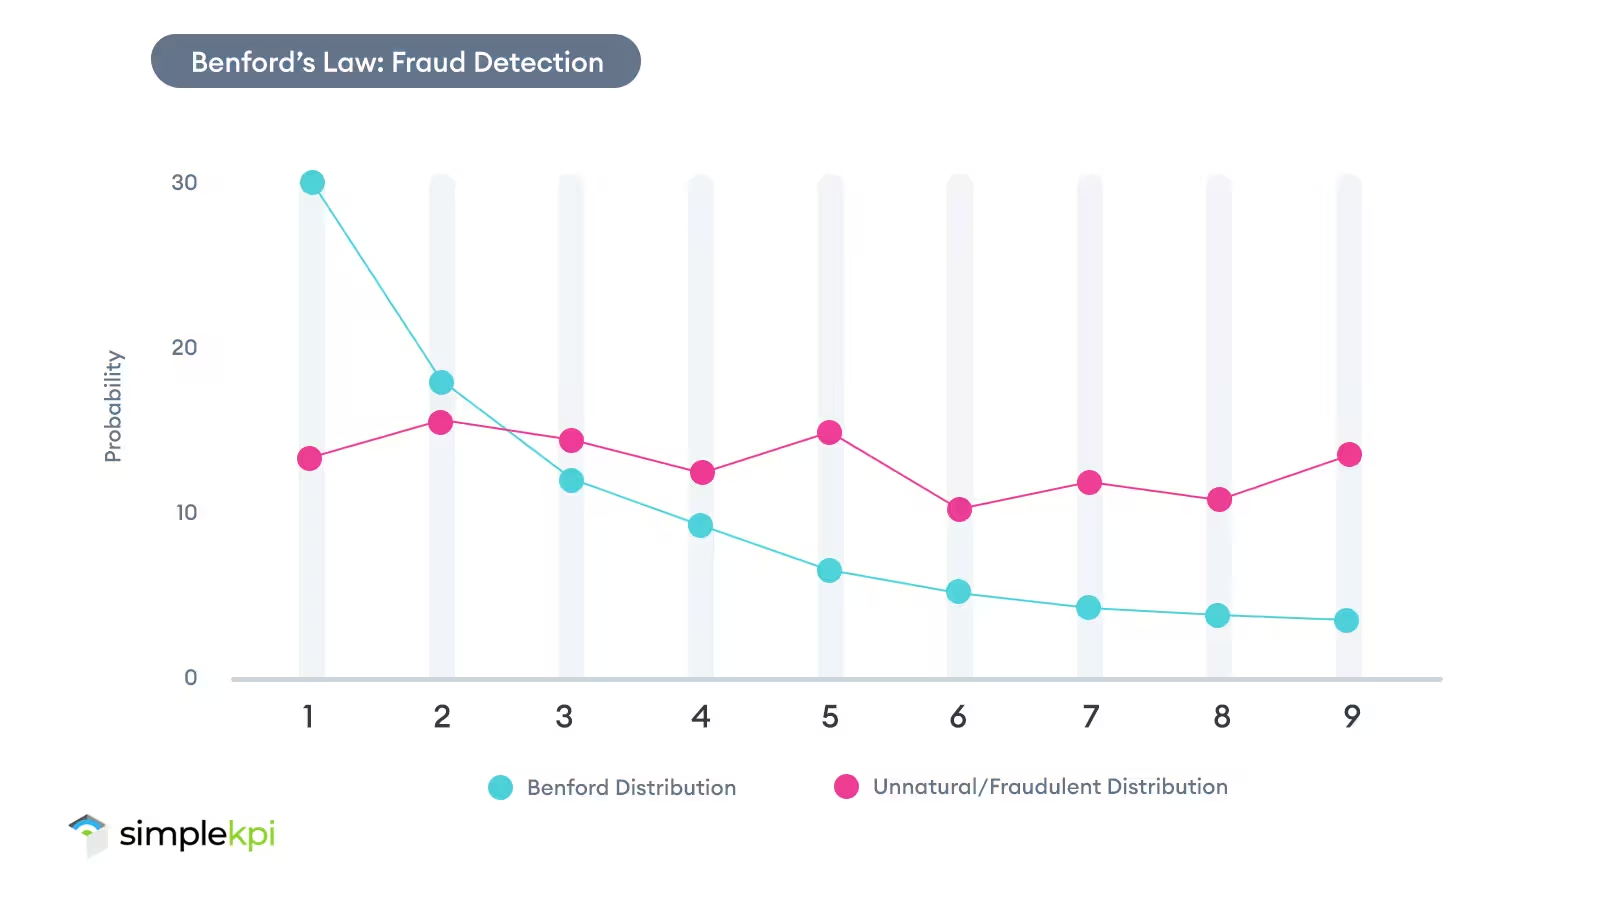
Well, it turns out it’s actually incredibly useful. For instance, Benford’s Law has been a go-to tool in fraud detection. If someone’s fudging numbers in tax returns or financial reports, the data often fails to follow this natural pattern.
It’s also a convenient way to validate scientific research. Analyzing these datasets helps spot errors or manipulations.
It could be claimed that Benford’s Law actually acts like a lie detector for numbers. And while it has traditionally been used in these scenarios, it also has exciting potential when it comes to KPI Tracking.
Why Should Businesses Care About Benford’s Law?
When it comes to running a business, the golden rule is that your decisions are only as good as the data you rely on.
That rings true for everything from setting targets, tracking performance, or making a big decision. You absolutely need to know and trust that your numbers are rock solid. That’s why data integrity and spotting patterns are such a big deal, making Benford’s Law more valuable than you might think.
Here’s the jaw dropping part: Benford’s Law is probably already a part of your life, and you didn’t even realize it.
Ever had your bank flag a suspicious transaction? Odds are, Benford’s Law helped spot it. Tax auditors, accountants, and even fraud investigators often rely on this principle to catch errors or shady behavior.
For businesses, this little law can uncover all kinds of valuable insights. If your data doesn’t match the expected pattern, it could point to:
- Errors in data entry: Mistakes happen, we’re only human, so catching them early can save significant problems later on.
- Manipulated KPI metrics: If someone (or something) is tweaking the numbers, chances are they’ll deviate from Benford’s natural patterns.
- Unusual trends: Unexpected anomalies in your KPIs might flag hidden issues or even opportunities worth exploring.
When your data is clean and accurate, your KPIs become a much better foundation for decision-making.
And the beauty of Benford’s Law is that you don’t need to be a math genius to use it.
Real-World Business Scenarios of Benford’s Law
Sales Performance Data
Let’s say you’re a company keeping an eye on your monthly sales KPIs across several different regions. And while using Benford’s Law, you notice something a little off. The leading digits for one specific region don’t quite match what would be expected versus the model.
This raises an automated flag and sparks an analysis of the data, uncovering inflated sales figures from deals that were recorded prematurely.
So, the key message here is that using Benford’s Law can serve as a valuable data integrity checkpoint, particularly when involving sales and commissions.
Marketing Engagement Metrics
Now, consider your marketing team examining their primary driver, that all-important engagement data. Typically, this would be things such as email open rates and click-through rates.
When they examine the leading digit distribution, they notice unusual patterns that don’t align with Benford’s expected outcomes.
Digging deeper, they uncover inconsistencies in their email tracking systems, enabling them to correct errors and produce more reliable campaign performance reports. Here, Benford’s Law proves its worth by validating metrics before critical decisions are made.
Operational Efficiency Metrics
Let’s take the manufacturing sector as another example. A company tracks equipment downtime as part of its operational efficiency KPIs.
Applying Benford’s Law, they detect deviations from the natural distribution of leading digits, signaling potential reporting errors or system misconfigurations that would generally be missed.
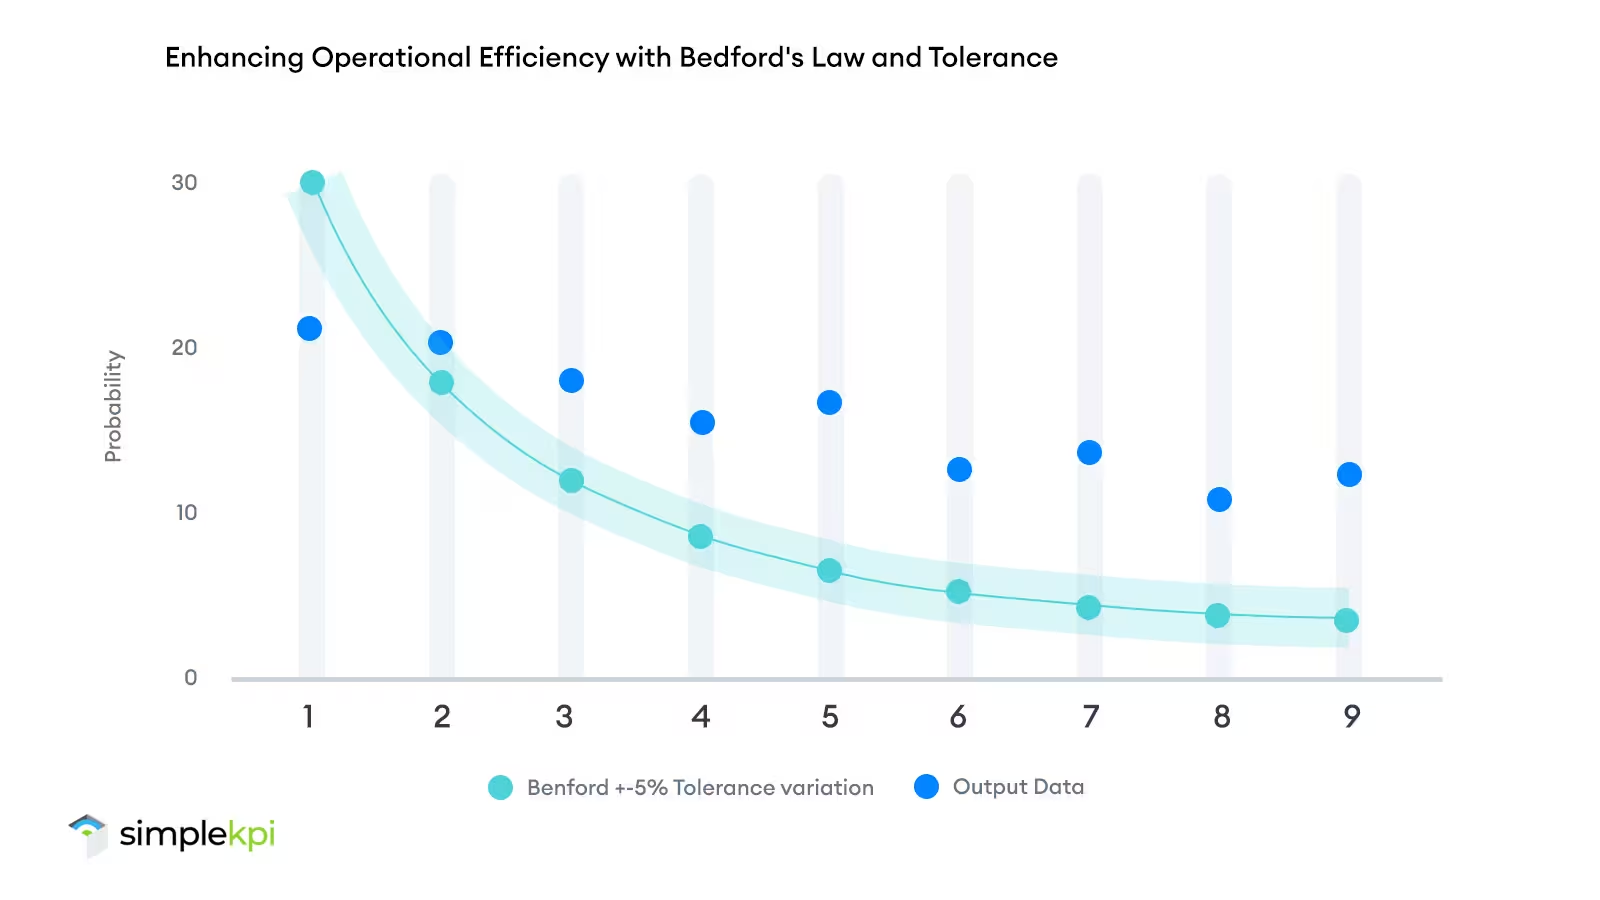
By proactively applying this law, businesses can add another layer of clarity, ensuring that their KPIs genuinely reflect the day-to-day operational realities.
Benefits of Using Benford’s Law in KPI Tracking
When it comes to tracking KPIs, it goes without saying that accuracy is king. Benford’s Law doesn’t just provide a little extra failsafe for occasional data errors; it provides you with a practical way to ensure your data is trustworthy and actionable.
Early Detection of Errors
Nobody in their right mind wants to make important decisions based on bad data.
Benford’s Law can act like an early warning system, helping us spot oddities in large datasets.
When the numbers don’t seem to match up with what we expect, it usually means something isn’t quite right. This can be a reporting mistake, a system hiccup, or even possible fraud. By catching these issues early, we can resolve problems earlier and limit the damage.
Increased Data Confidence
Data-driven decisions are only as good as the numbers behind them. Applying Benford’s Law helps ensure your KPIs are based on reliable and accurate data.
When your metrics align with natural patterns, you can trust that your reports reflect reality.
This increase can improve your business's ability to act decisively, knowing you’re working with a solid foundation of truth.
Proactive Decision-Making
Benford’s Law doesn’t just uncover issues; it gives you the opportunity to act before they cause significant damage.
Spotting anomalies early allows you to address potential problems like equipment malfunctions, reporting gaps, or inefficiencies, long before they impact your operations or financial performance. With better insights, you can plan smarter strategies, optimize processes, and allocate resources where they’ll have the most significant impact.
Challenges and Limitations in KPI Tracking
While Benford’s Law provides an interesting approach to spotting anomalies and validating data, it’s important to remember that it’s not a foolproof solution.
Like any tool, it has its limitations, and being aware of its challenges helps you use it effectively.
Context Matters
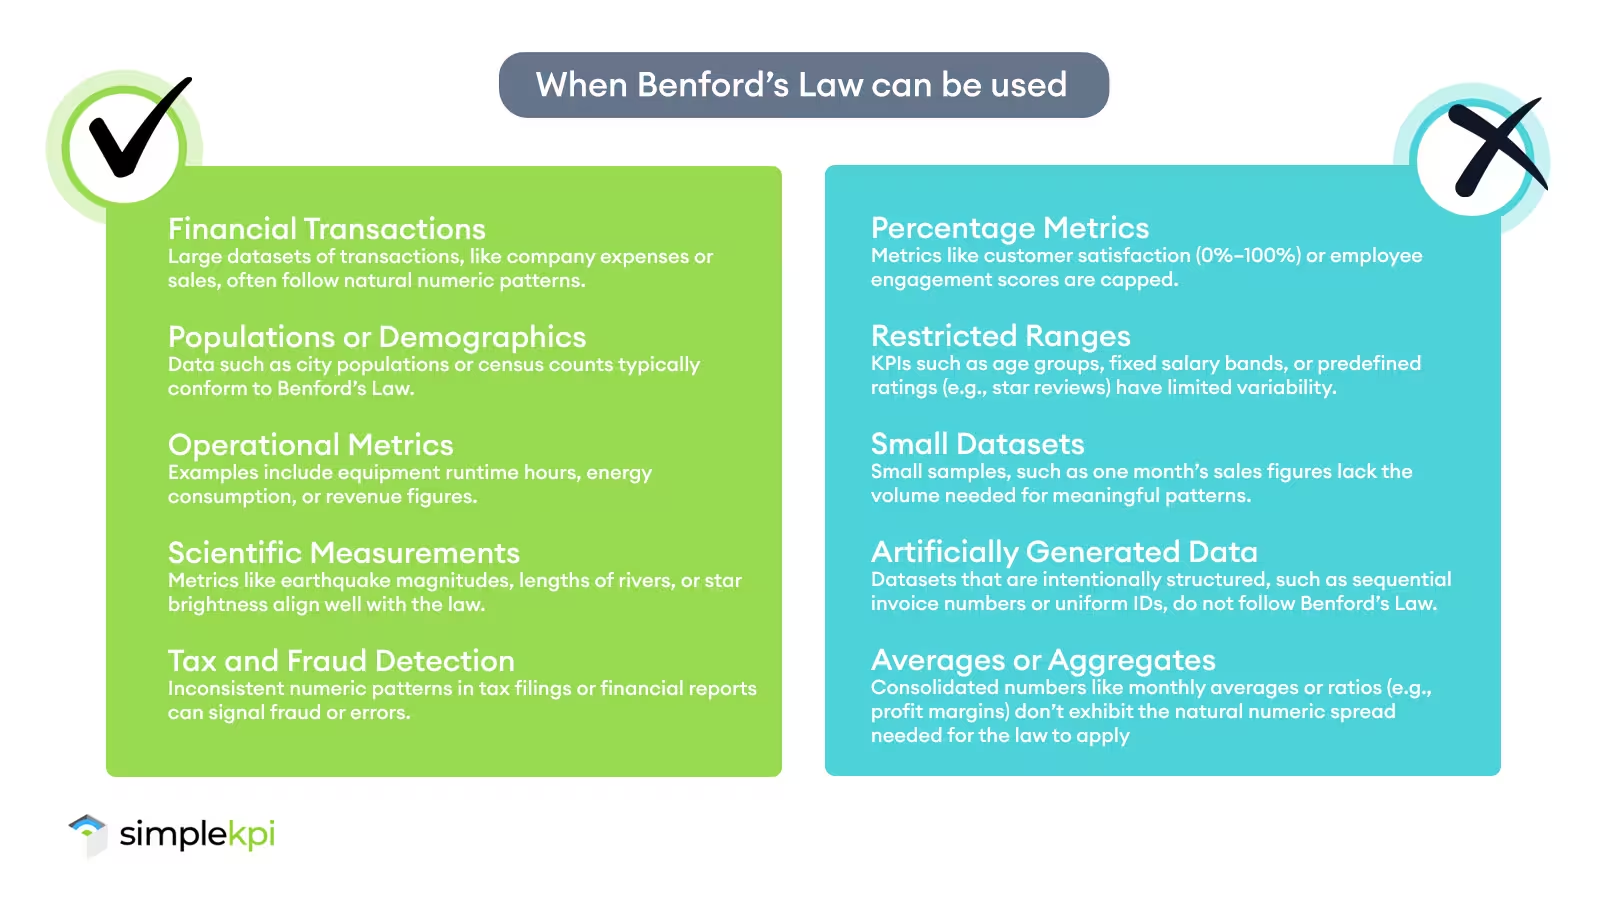
Benford’s Law works best in datasets with naturally varying, unrestricted values.
But not all KPI data fits this mold. For example, capped metrics like percentages, such as customer satisfaction scores ranging from 0% to 100%, don’t align with the patterns Benford’s Law predicts.
Similarly, datasets with restricted ranges, such as age groups or predefined salary bands, are unlikely to conform.
In these cases, applying Benford’s Law can lead to misleading conclusions, so it’s essential to evaluate whether your KPIs are an appropriate match.
Volume Dependency
The beauty of Benford’s Law lies in its ability to reveal patterns in large datasets, but it struggles with small or narrowly defined ones.
So, trying to apply it to a week’s worth of sales figures from a single store would result in a sample size that is simply too small for the expected distribution to emerge.
Without enough data points, deviations might appear as anomalies when they’re actually just statistical noise.
To get meaningful results, it’s essential to ensure you’re working with datasets large enough for the law’s patterns to take shape.
A Complementary Approach
Benford’s Law is arguably a powerful tool, but relying on it lock, stock, and barrel would be a mistake.
It should be deployed as part of a broader toolkit for data validation. For instance, while it might flag anomalies in financial transactions, it won’t explain why they occurred, or whether they’re even problematic.
Combining Benford’s Law with other validation methods, like trend analysis or benchmarking, provides a more complete picture.
Tools to help you track Benford's Law
Manual Analysis
If you’re looking for a straightforward way to test Benford’s Law, a simple spreadsheet will do the trick. Tools like Excel or Google Sheets allow you to extract the leading digits from your dataset, calculate their frequency, and compare them to the expected distribution.
For example, you could analyze the first digits of your monthly revenue figures to check for anomalies. While this approach is accessible, it can be time-consuming for large datasets and may require careful setup to ensure accuracy.
Reference: How to Apply Benford’s Law in Excel
Specialized Software
For a more robust analysis, specialized tools and programming libraries can save time and add precision.
Python, for instance, offers libraries like numpy for data manipulation and matplotlib for visualizing the distribution of digits.
These tools are ideal for large datasets or when you need to perform repeat analyses. Imagine running a Python script to analyze thousands of transactions across multiple departments—it’s faster and more scalable than manual calculations. However, this approach may require some technical know-how to get started.
Reference: Benford’s Law Implementation in Python
Integration with KPI Dashboards
To take your analysis to the next level, consider platforms that integrate Benford’s Law directly into your KPI tracking. Tools like SimpleKPI could incorporate anomaly detection algorithms that monitor datasets automatically and flag irregularities in real time.
For example, a dashboard might alert you when sales figures deviate significantly from expected patterns, allowing you to investigate potential issues immediately. Automated integration not only saves time but ensures consistency in your data validation process.
Reference: KPI Software for Data Integrity
Unleashing the Power of Benford’s Law for Your KPIs
Benford’s Law might seem like just a gimmick or a quirky numbers trick, but it’s so much more than that.
Helping you spot patterns and uncover issues you might have missed means that it certainly has its place in continuous performance tracking.
This can be from catching anomalies in financial reports to validating operational metrics.
So, whether you’re using a simple spreadsheet, advanced software, or an automated dashboard, it will add an extra layer of confidence to your KPI tracking.

by Stuart Kinsey
Stuart Kinsey writes on Key Performance Indicators, Dashboards, Marketing, and Business Strategy. He is a co-founder of SimpleKPI and has worked in creative and analytical services for over 25 years. He believes embracing KPIs and visualizing performance is essential for any organization to thrive and grow.