
When it comes to understanding data, we aim to produce simple and effective tools for our users to visualize the data how they want it.
Dashboards, graphs and charts are great, but sometimes the basics work just as well. So, we're happy to provide some simple pivot reports and dashboard charts to help out in those situations when raw data in a spreadsheet-style is just what the data doctor ordered.
So, with that in mind, we are pleased to announce we've rolled out a new pivot table report in SimpleKPI. This report will allow users to:
In this article:
- What Are Pivot Table Reports?
- But how do you use Pivot Tables?
- How to add a Pivot Table Report in SimpleKPI?
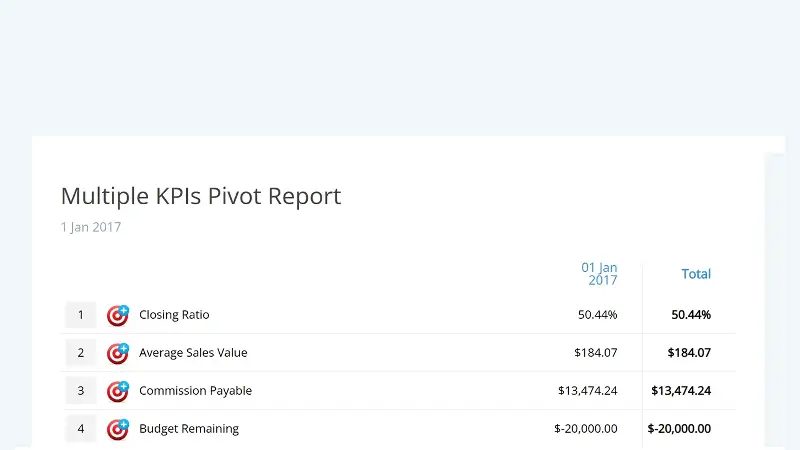
What Are Pivot Table Reports?
Pivot Tables are reports allowing you to quickly view large amounts of data in an organized format. They display your KPI (key performance indicator) data in an Excel-style table. This makes it easier to identify trends, analyze patterns, and make decisions based on the data.
Pivot Tables are considered among the most powerful data-organizing tools available. They allow users to analyze their data in new ways and make informed decisions based on what they learn from the reports.
But how do you use Pivot Tables?
It's actually quite simple. All you need to do is select the columns or rows containing your KPI data and drag them into the pivot table area. From there, you can create a custom report with the data that you need.
You can also use the sorting and filtering options to find the information that you're looking for quickly. This makes it much easier to spot trends and areas of improvement in your data.
If you need help getting started with Pivot Table Reports, no worries! Our team of experts are always available to provide expert advice. We'll walk you through the steps of creating a report and answer any questions you have.
How to add a Pivot Table Report in SimpleKPI?
These new reports and dashboard charts are available on your current SimpleKPI Account. You can access the new pivot table reports by going to Reports > Pivot Table or the dashboard charts and choosing the reports widget > Pivot table reports.
Once you have chosen the report, you can select the number of KPIs to show in the report and the date range. There are also various filters for displaying by user and groups, and additionally, all reports can be shared with other users or exported via Excel or PDF.

by Paulo De Sousa
Paulo writes on the technical side of KPI Tracking. He is a co-founder of SimpleKPI and has worked in the development and SaaS field for over 20 years. He is passionate about helping businesses make data-driven decisions through the use of data, reports, and analytics. With his deep understanding of business intelligence tools, he's adept at providing solutions that can help businesses reach their goals.