Key Performance Indicators (KPIs) help companies keep track of performance across different business areas such as Sales, Marketing and Customer Services.
They even find their way down to more defined processes typically found in manufacturing and development.
Keeping all this KPI focused information in one place not only helps with efficiencies but also with communicating performance across offices, teams, departments.
But setting up and tracking your KPIs in a dedicated software application is just the start, to really get the most from any performance strategy you need to communicate that performance in the most understandable way.
Step forward the KPI Dashboard
These charts provide 'at a glance' insights into performance and trends that would be otherwise nearly impossible for us mere mortals to get from the raw data.
But where to start?
What better way than a series of the most commonly used KPI Dashboard Templates designed with best practise in mind.
The Sales Dashboard
Sales teams need inspiration in many forms, incentives and bonuses being the most common forms.
More and more companies are benefitting from communicating sales performance across teams in real-time as part of this strategy.
Using league tables and access to personal performance information for team members more openly encourages a more competitive sales culture.
And its not just the teams that benefit. Sales leader can see this performance data on their dashboards without having to wait until the end of a sales period. Who is performing well? Is the team or department achieving its collective goals, or what is the seasonal trend? are just some of the answer’s dashboards can provide.
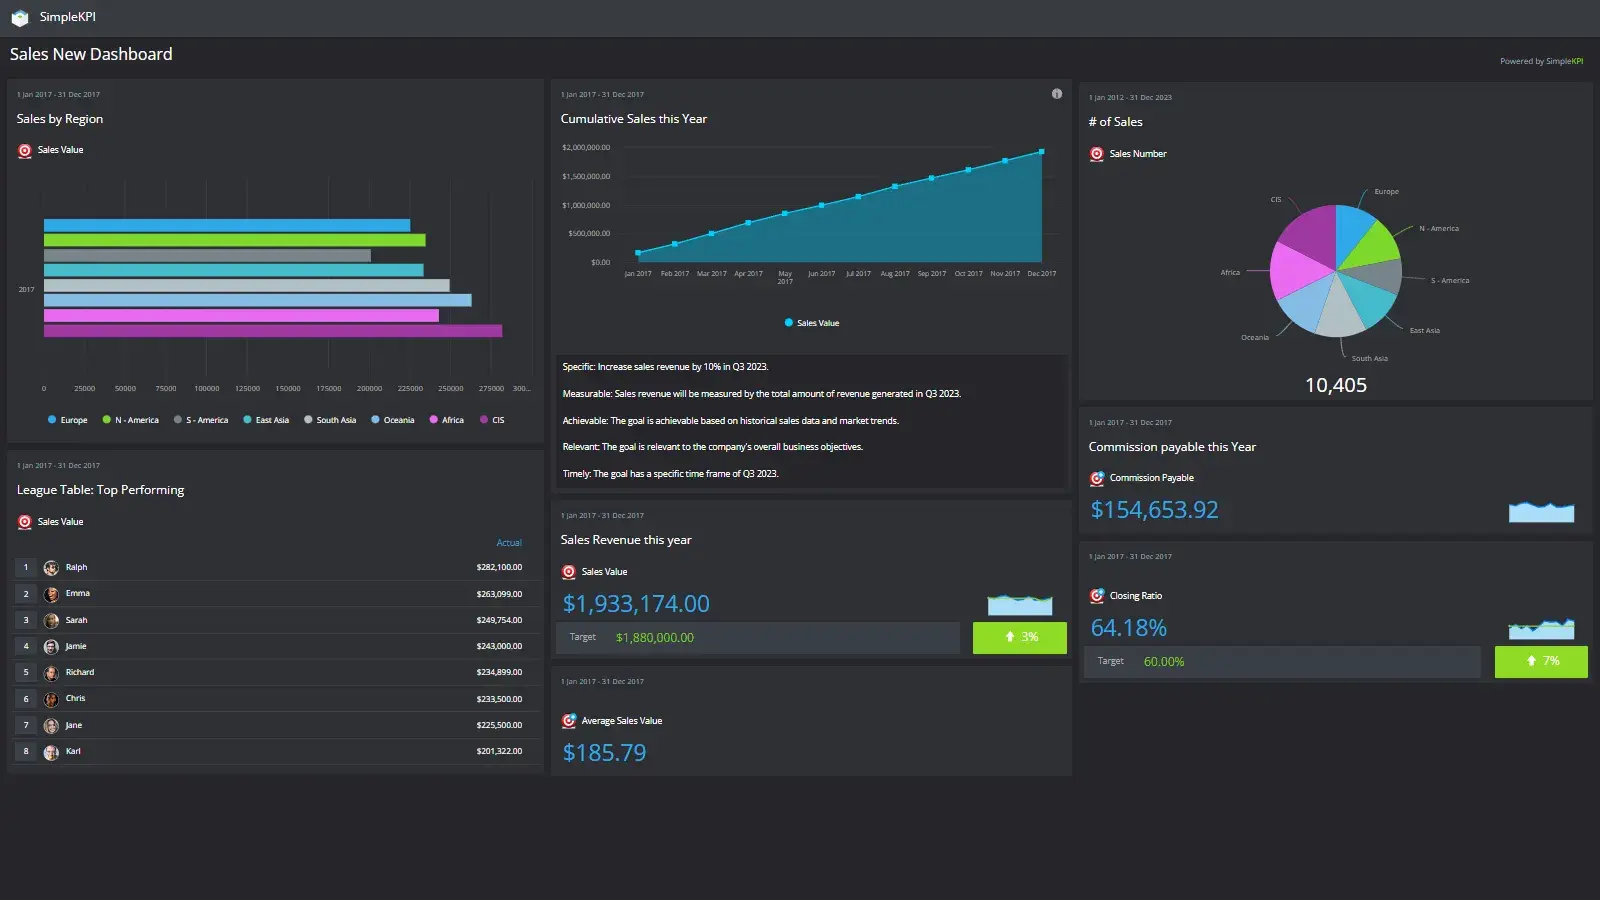
Some Example KPIs on the Dashboard:
- Attempted Up Sales
- Sales Volume
- Repeat Sales Revenue
- Opportunities
The Marketing Dashboard
In todays marketing world we are awash with data.
It's generated in near endless volumes. From every type of interaction on Social Media, Websites and Email through to purchasing and after sales. The volumes are truly staggering and managing this data can be a complicated process.
But it's also a great opportunity to learn and grow. Opportunities can be buried in this data and more targeted campaigns can yield better marketing ROI.
A Marketing Dashboard is not just a great way to track leads. They can also be used for tracking marketing financial information such as budgets, expenses and advertising costs.
Linking this information through to real world purchases provides valuable ROI information.
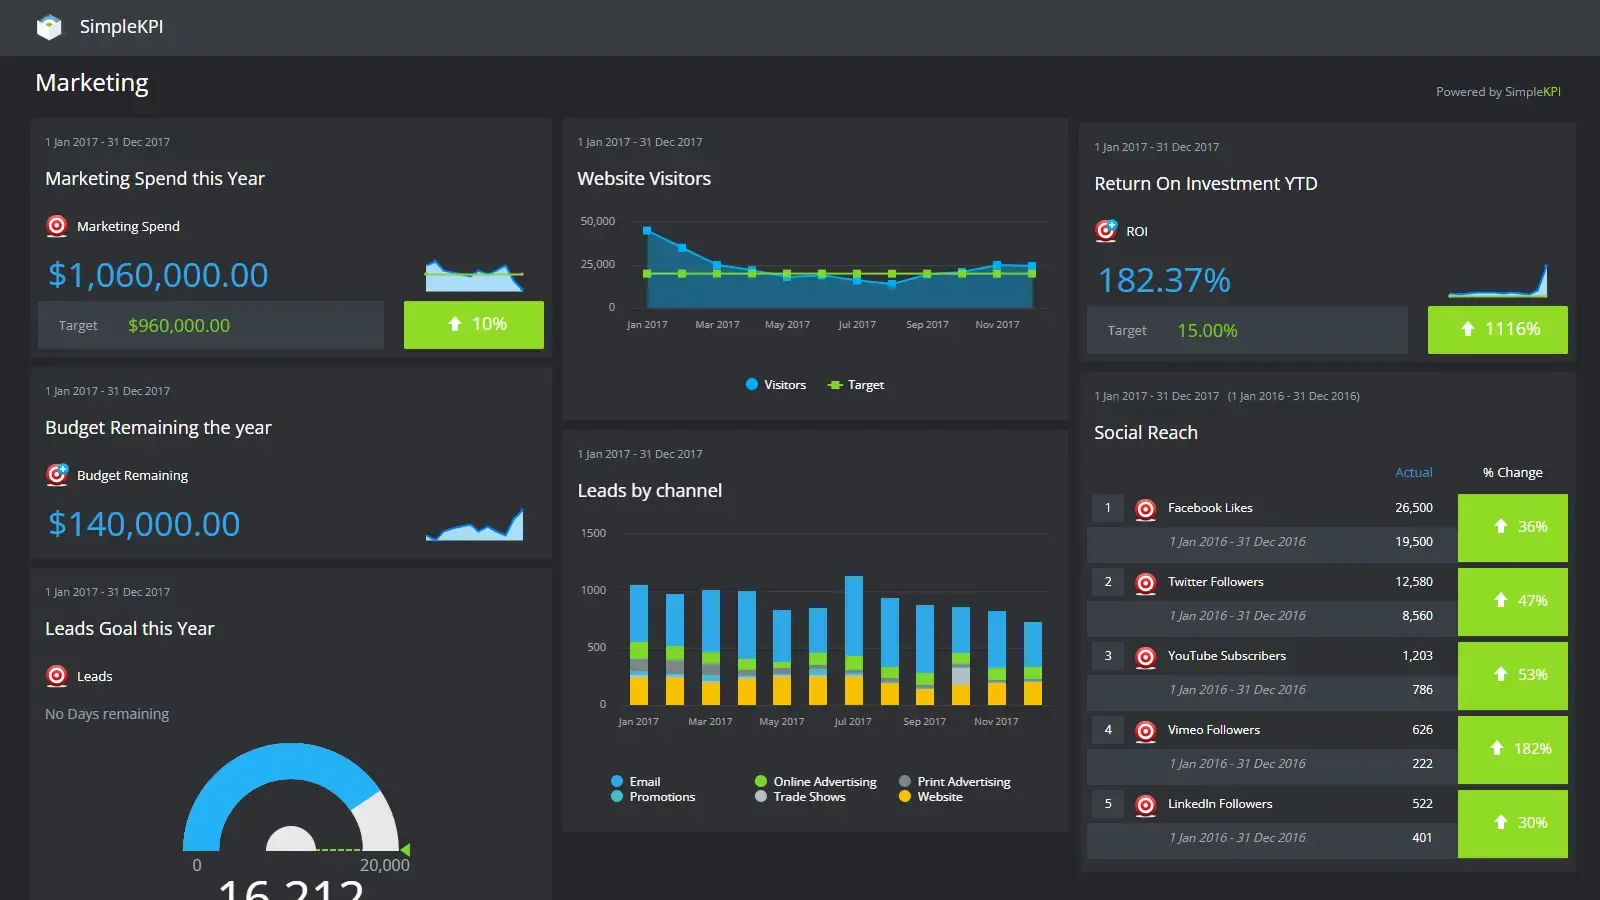
Marketing Example KPIs on this Dashboard:
- Marketing Spend
- Leads to Goal Ratio
- Sales Volume
- Leads by Channel
- Marketing Budget
Alternative Marketing Dashboards
The Financial Dashboard
It's true that most financial information is contained in existing apps such as Myob, Sage or Xero.
And these apps are clearly the right location for such important information. But they often exist is isolation. The data separated from other business areas.
Financial Dashboards are a great way to consume data from financial systems with other metrics to generate real insights. Such as, the production cost per unit manufactured during a certain period.
Generating simple graphs and charts provide a simple way to visualise the health of the organization and alert to any significant swing from the norm.
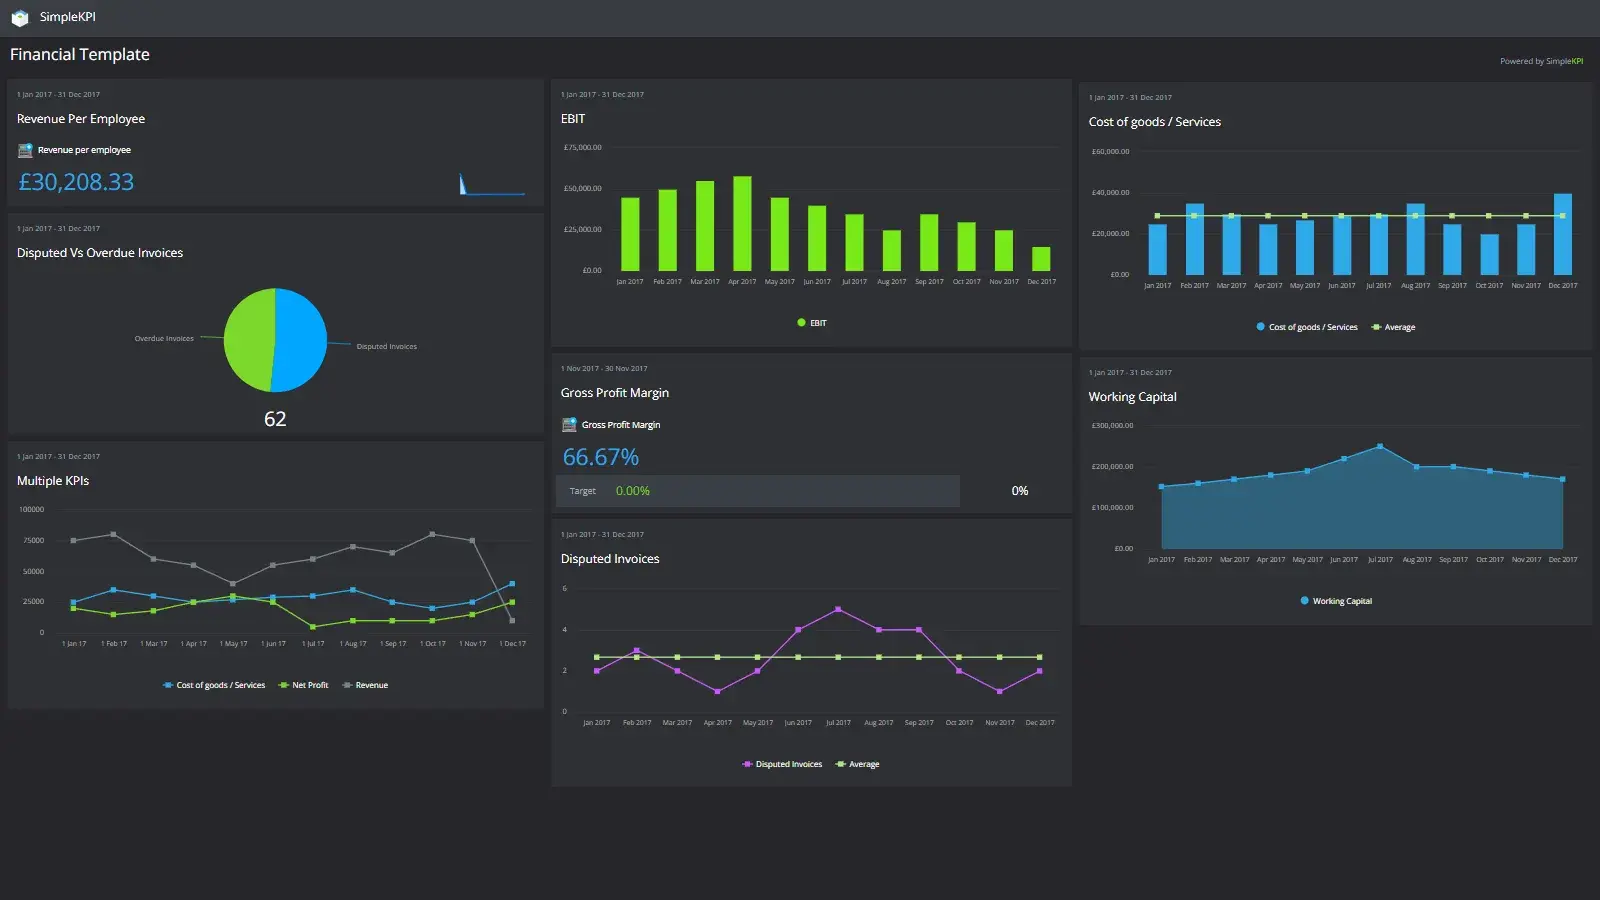
Financial Example KPIs on this Dashboard:
- Cost of Goods / Services
- Daily Cash
- Gross Profit Margin
- Overdue Invoices
- Working Capital
Alternative Financial Dashboards
Customer Services
Keeping customers is about as important as getting them in the first place. Retention, particularly in the service sector is a huge factor in a successful business model.
Having an early warning system such as a Customer Service Dashboard is a great way to alert to any issues with a product or service in the early days.
This response time can help retain trust and satisfaction during problem times - communication and responsiveness being the most important factors to customers facing issues.
Monitoring all the stages of a customer’s interactions can be charted on a dashboard and used to create more efficient processes.
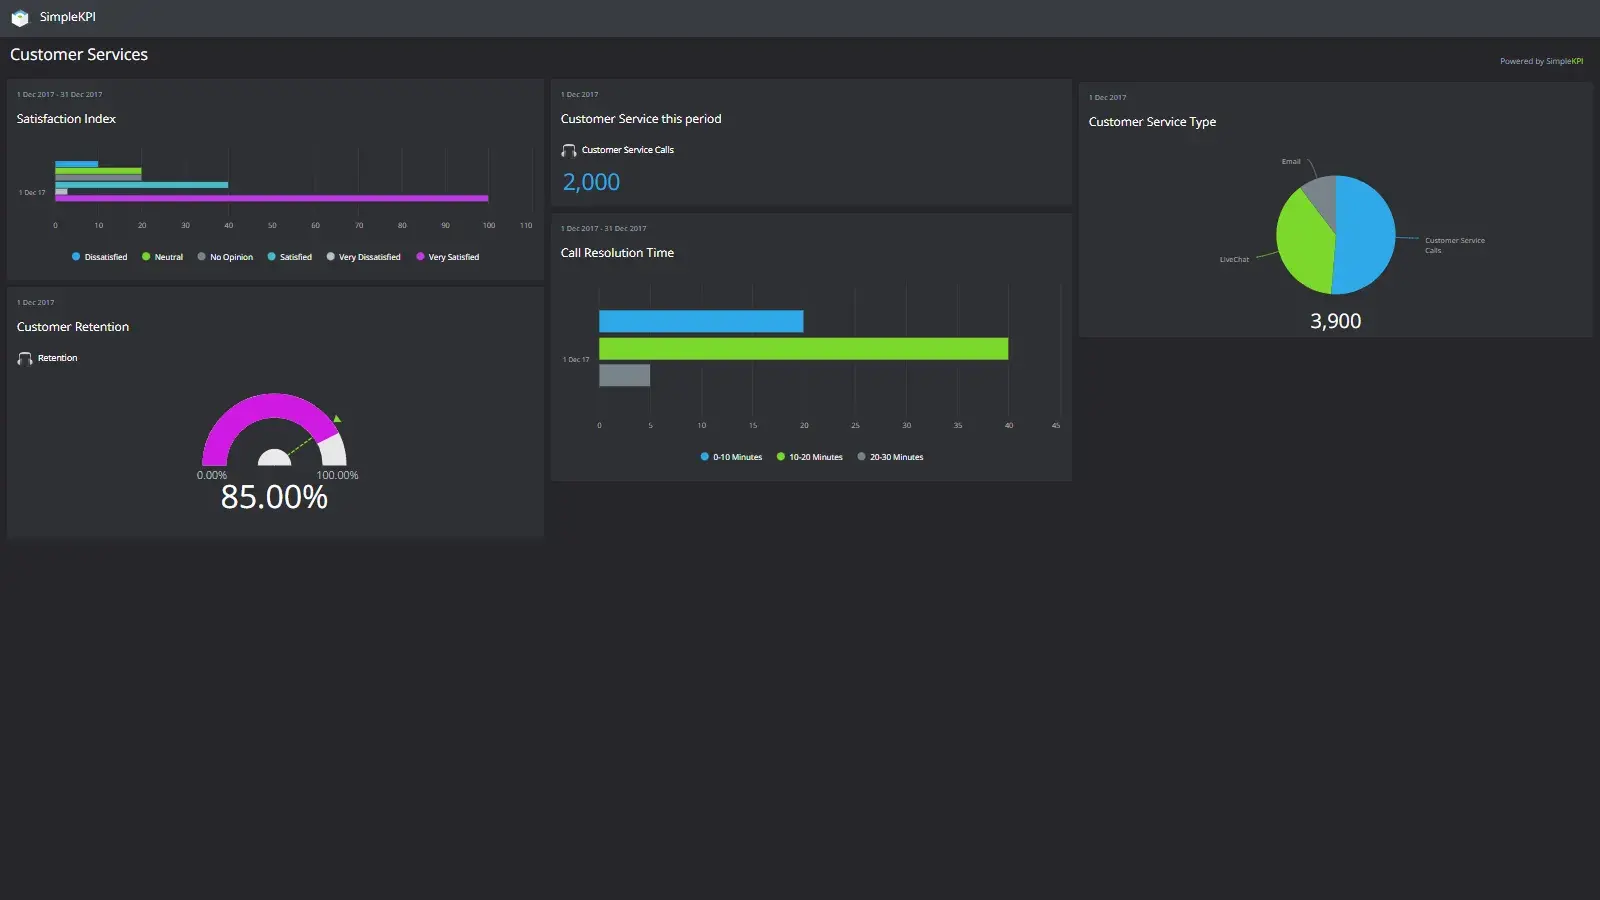
Customer Service Example KPIs on this Dashboard:
- Complaint Percentage
- Complaint Resolution Time
- Overdue Service Requests
- Overdue Invoices
- Warranty Claims
Alternative Customer Service Dashboards
The Human Resources Dashboard
Your Company is only as good as its employees.
So, ensuring you are attracting and keeping your talent is vitally important for the health of a business.
HR Dashboards can help to manage staffing levels and employee welfare. They are the first line of defence against issues that result in great talent leaving the business.
Human Resource professionals can have instant access to absenteeism rates, employee satisfaction and other metrics designed to monitor a vibrant and enthusiastic workforce.
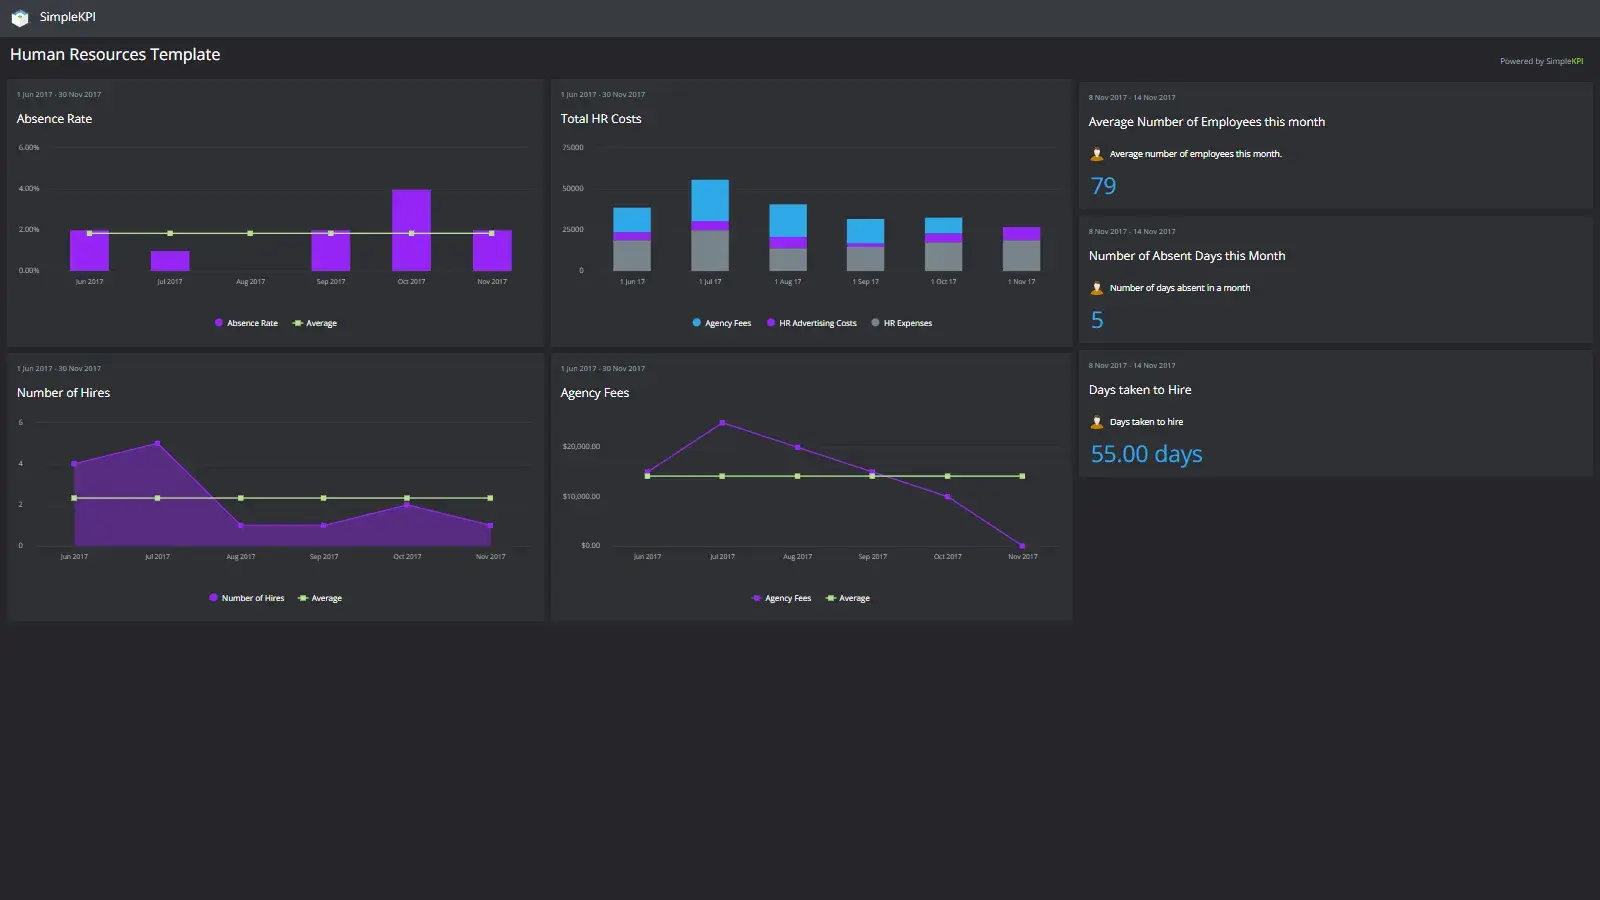
Human Resources Example KPIs on this Dashboard:
- Absence Rate
- Agency Fees
- Days taken to Hire
- Overdue Invoices
- Employee Satisfaction
Alternative Human Resources Dashboards
The Retail Dashboard
Retail is challenging. Sometimes the smallest changes have the largest impacts.
Knowing your customers, their habits and when they are more likely to buy is key in any retail business.
Retail Dashboards allow retailers to track Seasonal behaviour and forecast using historic trends to help plan inventory and stock levels.
They are a great way to see growth of both offline and online sales and see the success factors that are driving this growth.
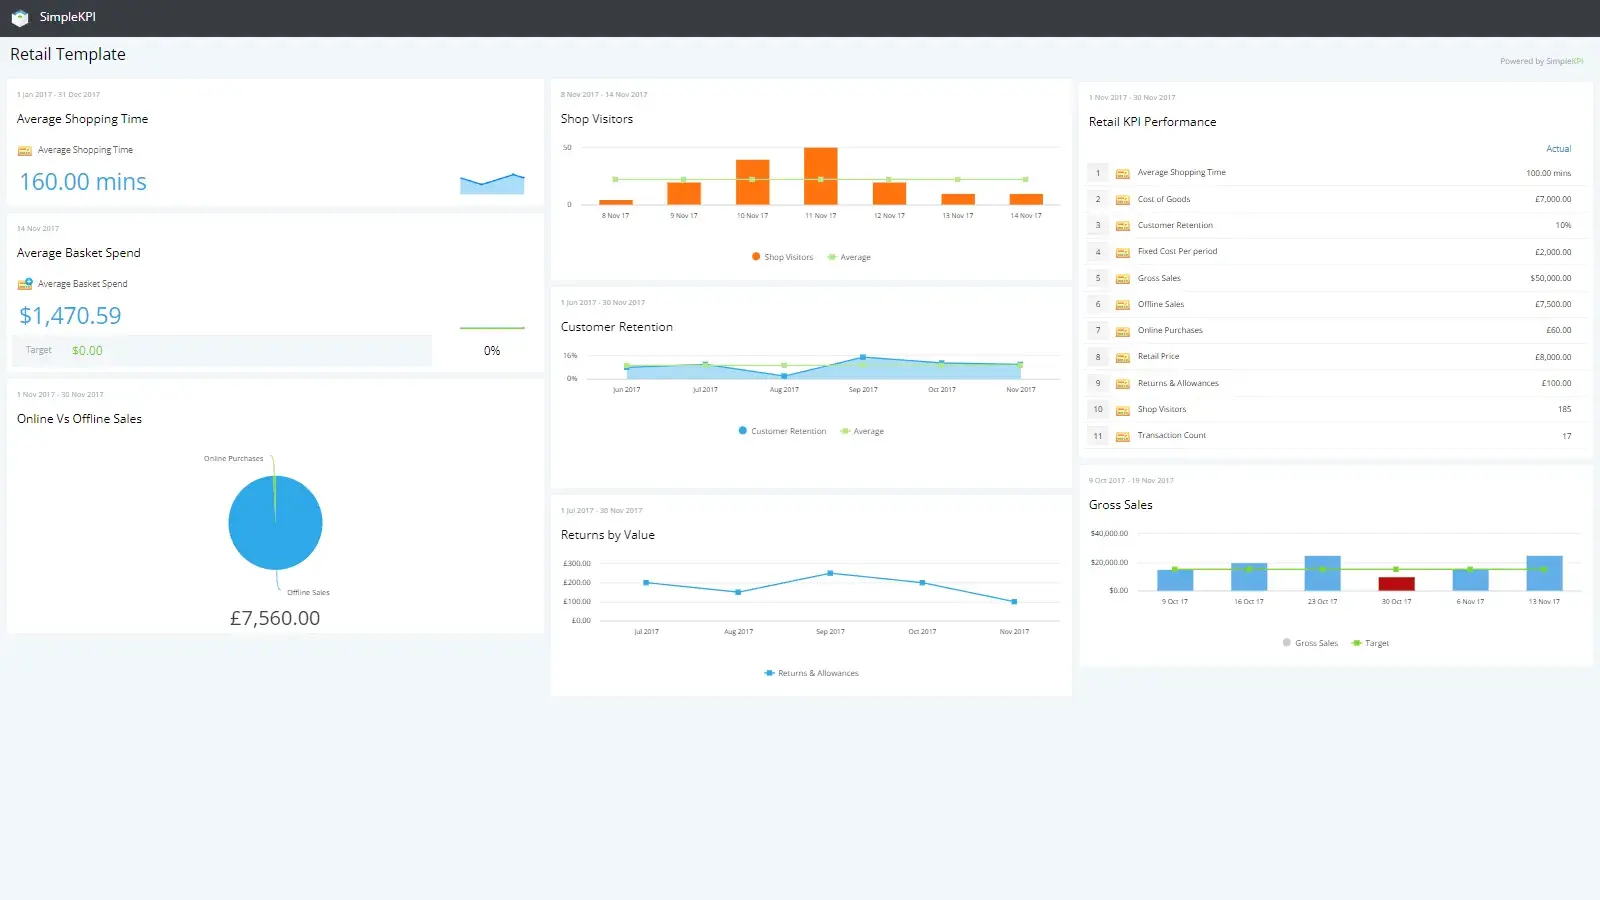
Retail Example KPIs on this Dashboard:
- Average Basket Spend
- Retail Price
- Cost of Goods
- Overdue Invoices
- Customer Retention
Alternative Retail Dashboards
The Manufacturing Dashboard
Successful manufacturing is the perfect mixture of quality, volume and efficiency.
Those essential elements are what make those products reliable, desirable and ultimately profitable.
Real-time monitoring of manufacturing processes and machinery gives production staff the information needed to keep the production process running along smoothly.
How many units a machine is generating, how many defects or even how productive an operator is can be easily converted into dashboard graphs.
This information can be used to tweak different elements of the manufacturing process to create more efficiencies.
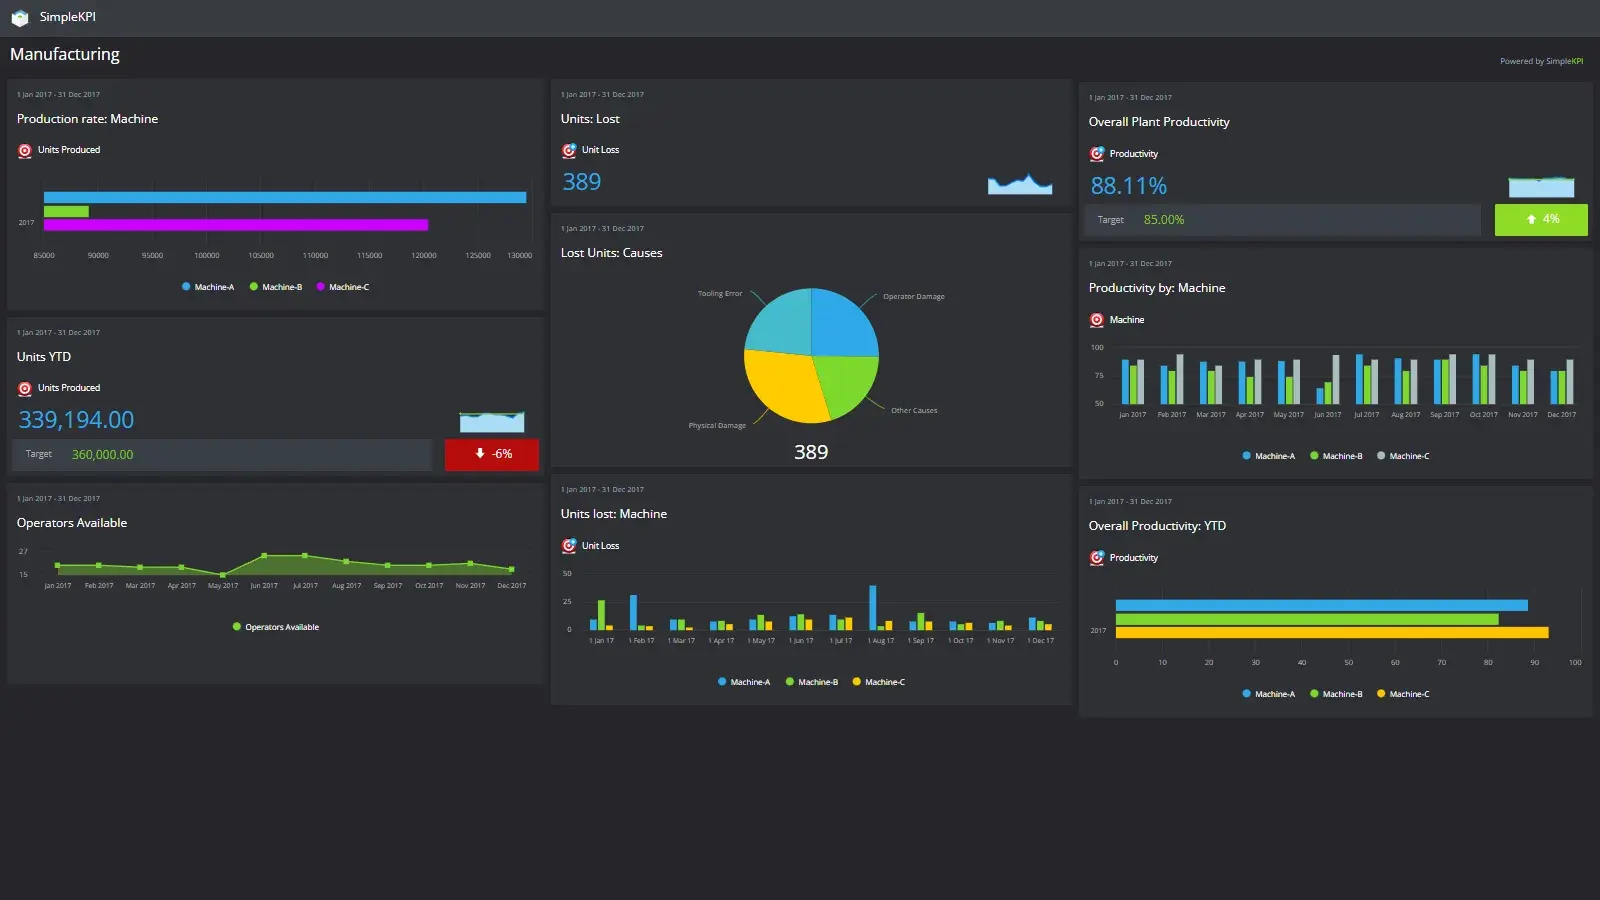
Manufacturing Example KPIs on this Dashboard:
- Production Rate
- Units Lost
- Operator Productivity
- Overdue Invoices
- Defects by Causes
Alternative Manufacturing Dashboards
The E-Commerce Dashboard
If you are selling online, then an E-commerce dashboard has become an essential part of your business.
Due to the vast amounts of data automatically generated for every interaction from prospective customers to established customers, Dashboards to display those KPIs have become the easiest way to visualize that data.
When data is displayed in this way, site owners can benefit from all manner of otherwise hidden insights.
And pulling these insights from systems automatically such as CRMs, Payment Gateways and Google Analytics into one simple dashboard makes keeping an eye on your E-Commerce KPIs a breeze.
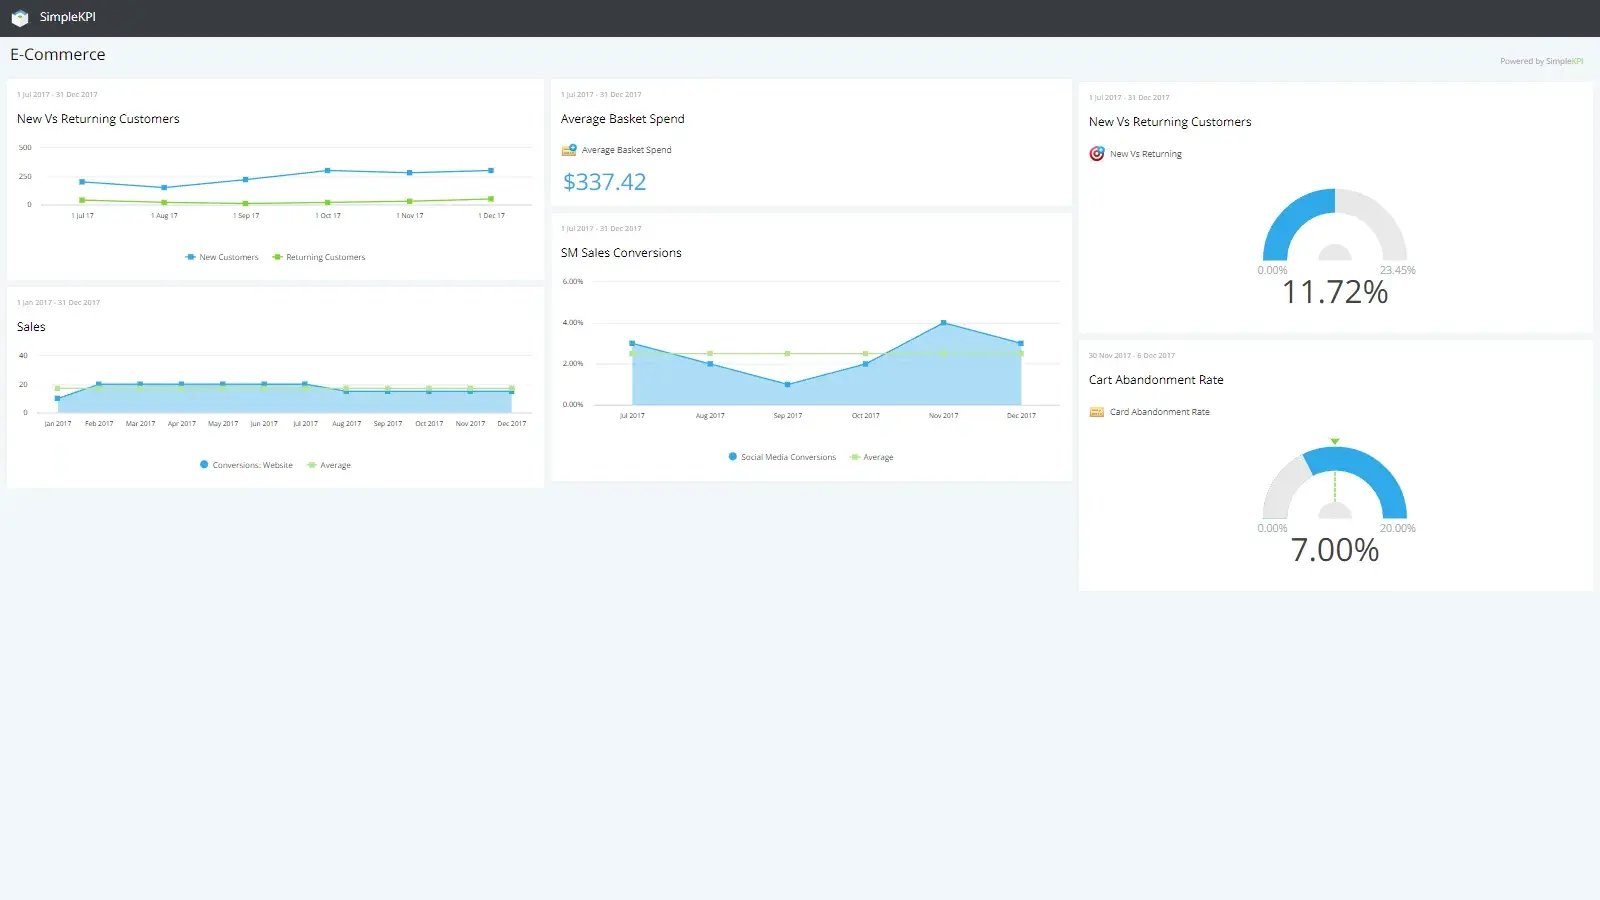
E-Commerce Example KPIs on this Dashboard:
- Average Basket Spend
- Cart Abandonment Rate
- New vs Returning Customers
Alternative E-Commerce Dashboards
Learn More
You can find more examples and templates of various KPI Dashboards here

by Stuart Kinsey
Stuart Kinsey writes on Key Performance Indicators, Dashboards, Marketing, and Business Strategy. He is a co-founder of SimpleKPI and has worked in creative and analytical services for over 25 years. He believes embracing KPIs and visualizing performance is essential for any organization to thrive and grow.