
In this article:
- The Sales KPI Leaderboard
- The Executive / Strategic Sales KPI Dashboard
- The Sales Activity Dashboard
- The rise of Small Business Analytics
Most Sales leaders and managers already use some form of Sales focused KPI Dashboards or KPI Reporting. It's become an integral way to monitor daily team performance. In any sales orientated environment, it's imperative that you know exactly what's going on, and by who at all times.
Nevertheless, with so much good data now being generated, combined with a near limitless range of KPIs to choose from - a well-intentioned Dashboard can become a confusing concoction of mixed measures and bloated metrics, serving little to no purpose at all.
Good sales dashboards should be efficient, streamlined, easily understood and focused on the audience. They should provide all the Key Performance Indicators (KPI) the sales leader needs at a glance to make insightful decisions..
For a sales dashboard to be truly effective, each dashboard needs to be logical and fit for purpose. For example, if you're looking at the top-level sales performance for the organisation, then you're probably not interested in an individual's daily sales volume. This 'clutter' just gets in the way.
So how do you go about selecting the right Sales KPIs and creating truly meaningful dashboards? Well we've done the hard work for you, we've put together 4 of the most important Sales focused KPI dashboards. These cover various aspects of monitoring the Sales process, performance and reporting.
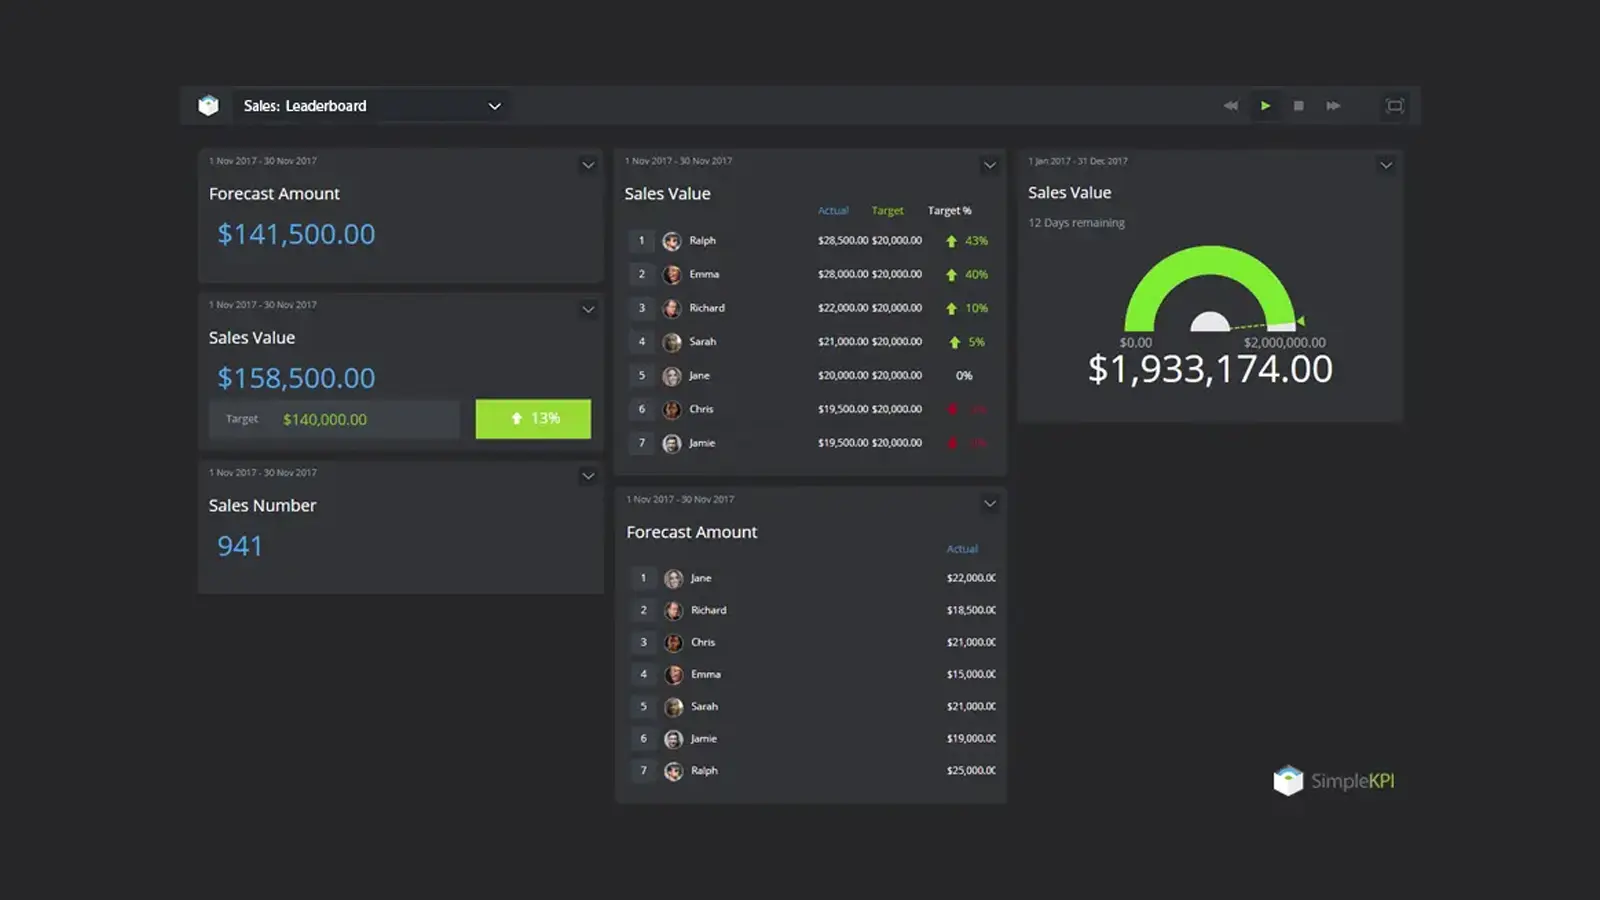
The Sales KPI Leaderboard
The 'Sales Leader Board Dashboard' is a great way to see the status of the teams and individual's sales performance against targets in real-time. It can also be used to incentivize performance amongst individuals. This dashboard is also commonly shared on communal monitors or individual workstations, providing sales reps with instant access and transparency of their performance.
In addition to tracking progress against target KPIs in real-time, many organizations use this dashboard as part of incentive structures — rewarding top performers with bonuses or acknowledgments such as 'top seller' status. It is also possible to display additional information on the leaderboard, such as sales goals and team targets, giving everyone in the organization complete visibility into the performance expectations of each team.
Overall, a Sales Leader Board Dashboard can help to motivate reps to achieve their best performance while also providing managers with valuable insights that can be used to adjust strategies or modify tactics if necessary.
See a live version of this dashboard
The main questions this dashboard aims to answer are:
- How is the team performing against targets?
- Which team members are performing well this period?
- What is the total team revenue generated this period?
- Are we on target to hit our annual goal?
What KPIs are in the team KPI Dashboard?
- Sales, Bookings or Orders this month.
- The value of individual and team sales this period.
- The team sales against the annual goal.
- The forecast Amount this period.
- Individual sales performance against their target.
The Executive / Strategic Sales KPI Dashboard
The executive (also known as the strategic) dashboard provides a cumulative view of the sales performance of the whole organization. These dashboards are engineered for the organization's board members, CEO / CFO and often show performance across multiple areas, business units, or product lines simultaneously. They typically use trends and comparisons to show a historical picture of sales performance. These Dashboards are a great way to keep those members of an organization who are disconnected from day-to-day sales informed.
The executive dashboards often include KPIs such as net profit, market share, customer satisfaction ratings, and revenue growth. By tracking these metrics over time, the board members can evaluate how their organization performs compared to its competition and make any needed changes to remain competitive. This type of dashboard also helps in understanding how sales trends impact the business's overall performance.
Organizations need to develop a comprehensive set of KPIs to ensure that this dashboard is providing accurate information. This will enable them to measure how their sales performance impacts their overall business objectives and then take corrective action if needed. It's essential for businesses to remember that these executive dashboards are just one tool in the tool belt of understanding where an organization stands.
See a live version of this dashboard
The main questions this dashboard aims to answer are:
- Is the business reaching its sales targets?
- How does sales compare against previous periods?
- How accurate is our forecasting?
What KPIs are in the Executive Sales Dashboard?
- Forecast this month.
- Sales this month.
- Sales this Year.
- Forecast vs Actual over the year cumulative.
- Sales this year compared to last, by month.
- Average Win Ratio / charted.
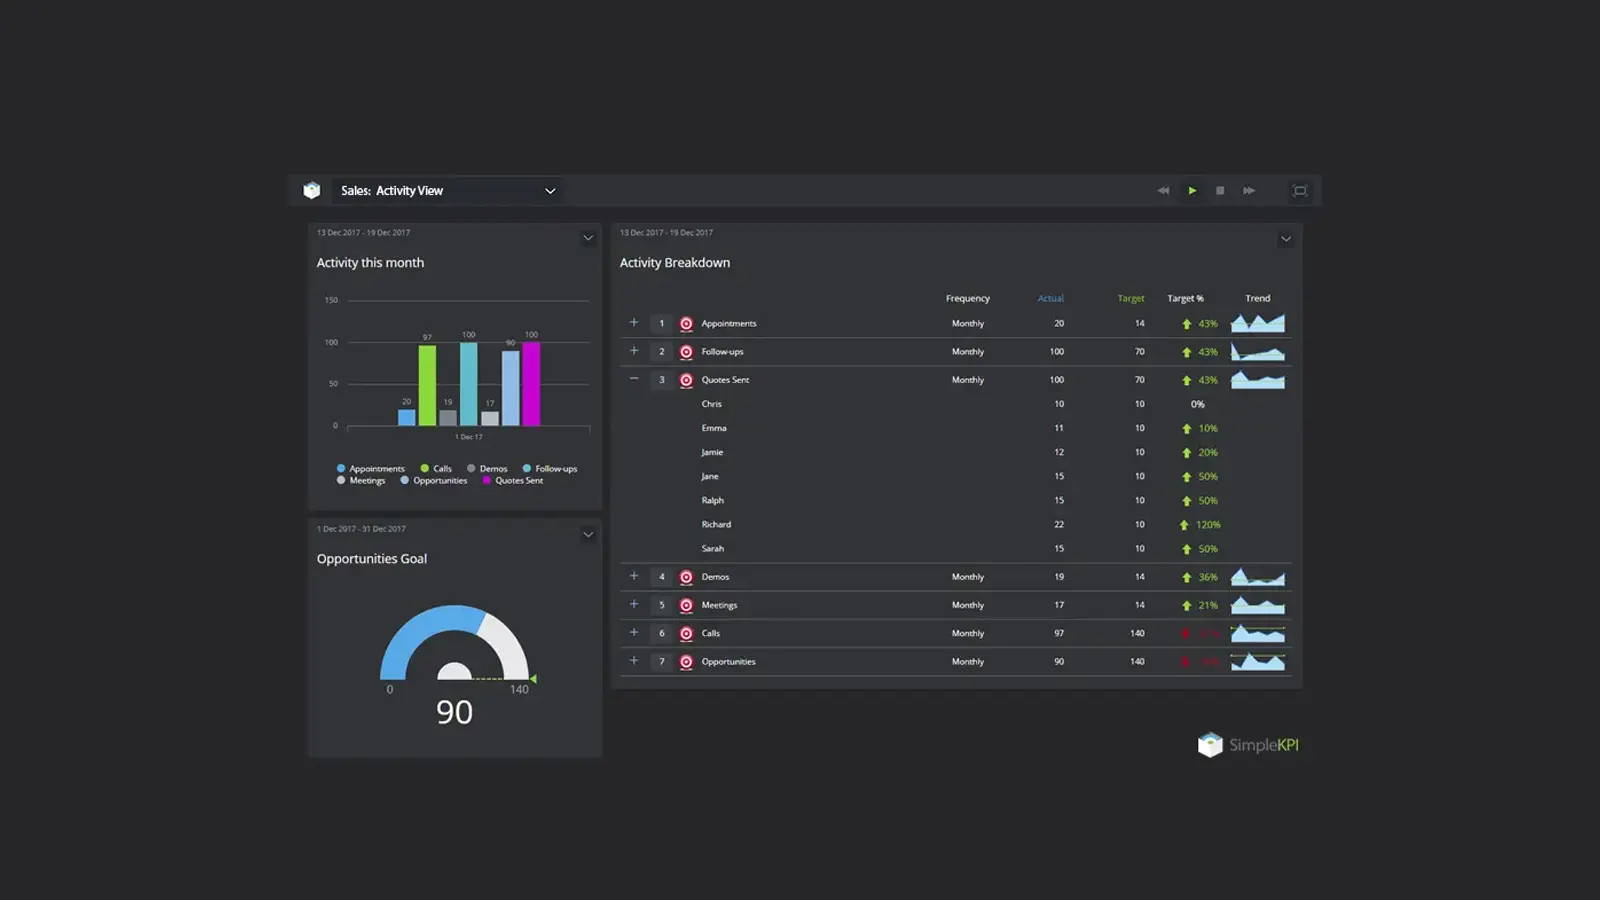
The Sales Activity Dashboard
Activity dashboards are a good way to monitor all those connected activities contributing to higher sales. They help instill discipline in the complete sales process by providing accountability metrics that are easily translated into performance. These dashboards also assist in highlighting any areas for improvement in individuals that can be addressed with training and provide insight into activities that are becoming detrimental to the process.
Sales activity dashboards typically contain data related to sales pipelines, customer accounts, payments received, and other associated metrics. They allow users to quickly identify areas where improvement is needed and suggest potential solutions. For example, they can provide insight into the effectiveness of particular strategies- clearly indicating which ones are performing well and which should be reevaluated or adjusted. This type of feedback helps ensure that everyone in the business has visibility into the performance of their activities so they can continue to make informed decisions.
In addition to tracking sales process performance, activity dashboards help businesses monitor how customers feel about their experience. From reviews to surveys, customers' feedback provides an invaluable window into how specific individuals interact with the business's products and services. Tracking customer satisfaction helps companies identify issues quickly- making it easier to make necessary changes or address any concerns before they become significant problems.
See a live version of this dashboard
The main questions this dashboard aims to answer are:
- What tasks are my team spending the most time on?
- Are activities generating opportunities?
- Are team members hitting their activity targets?
What KPIs are in the Sales Activity Dashboard?
- Activities this month.
- Activities breakdown.
- Opportunities generated.
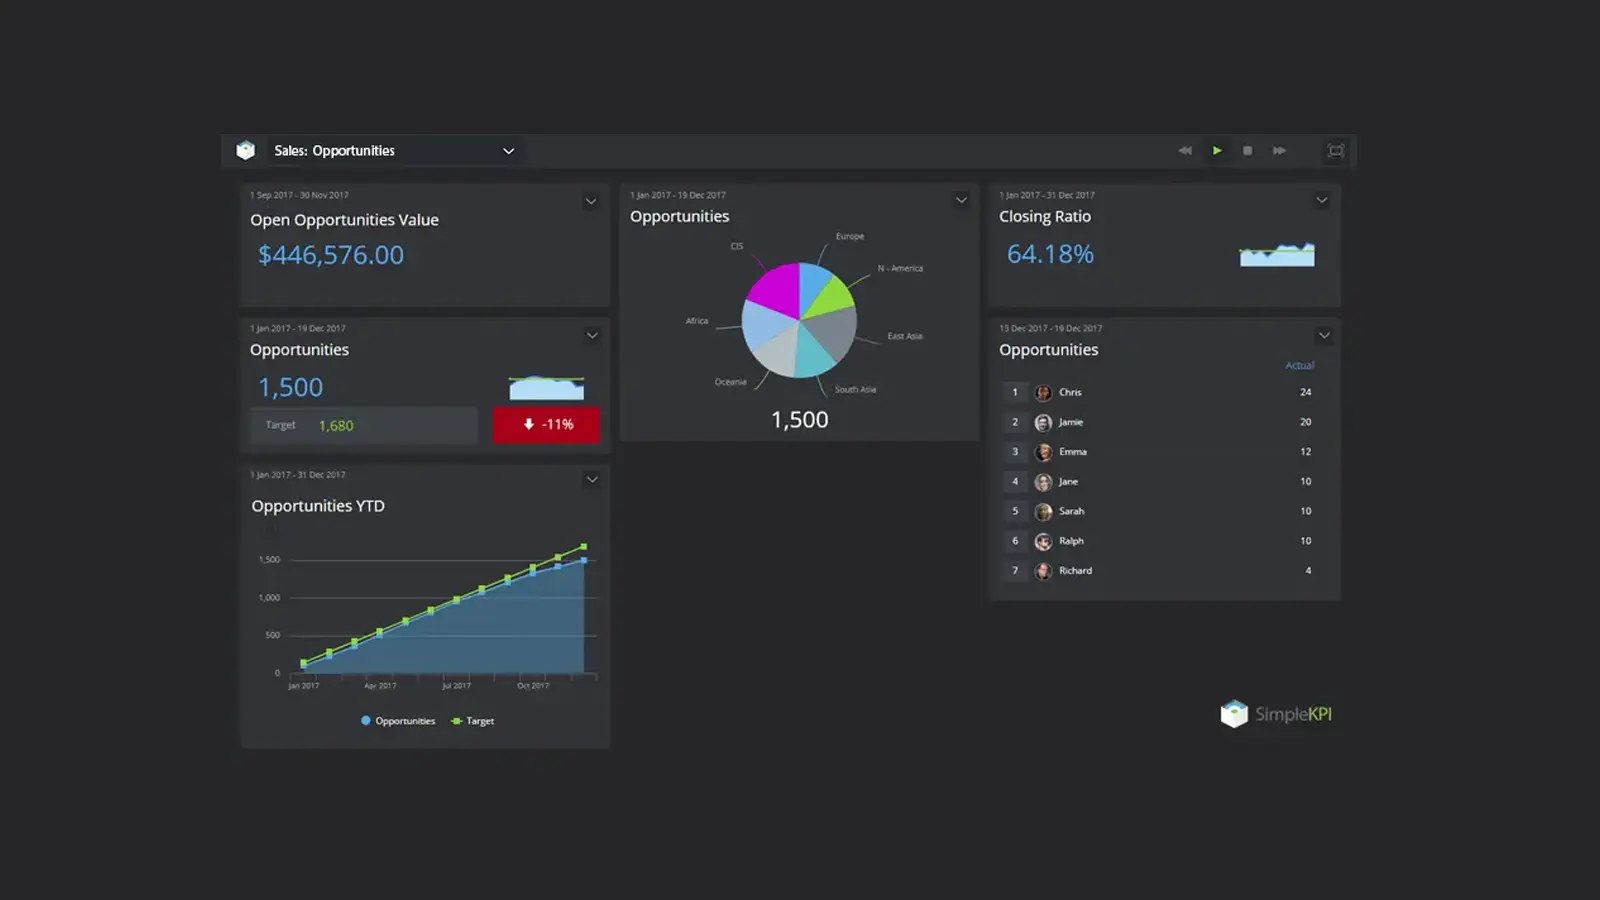
The Sales Opportunities Dashboard
Opportunities are vital in ensuring your team has enough chances to close deals and convert them into sales. The Sales Opportunities dashboard is designed to show the latest opportunities and displays them by the total identified, the region/area and the closing ratio. This shows where opportunities are being generated and their potential revenue. Additionally, this dashboard can be used to track progress on specific opportunities and identify areas of improvement.
For managers, the Sales Opportunities dashboard provides valuable insights into their team's performance regarding opportunity identification and conversion. Access to this information helps them make smarter decisions about resource allocation, budgeting, and pricing.
Finally, this dashboard can also be used to highlight areas of success and areas for improvement. Tracking trends over time, you can accurately identify which strategies are working well and which need more attention. This allows your team to focus on building up those proven prosperous areas while changing certain activities or processes that may not yield the desired results.
See a live version of this dashboard
The main questions this dashboard aims to answer are:
- Are we generating enough opportunities?
- What is the potential value of all open opportunities?
- What is our current closing ratio?
What KPIs are in the Sales Opportunities Dashboard?
- Opportunity Value.
- The number of opportunities generated.
- Opportunities by Region / product / business unit.

by Stuart Kinsey
Stuart Kinsey writes on Key Performance Indicators, Dashboards, Marketing, and Business Strategy. He is a co-founder of SimpleKPI and has worked in creative and analytical services for over 25 years. He believes embracing KPIs and visualizing performance is essential for any organization to thrive and grow.