How to manage all this KPI data?
Small businesses often struggle to make sense of the considerable amounts of data they generate.
However, this data can offer more than just operational information, such as stock control or sales. It can indicate the business's future health and even unearth growth opportunities.
But how can businesses leverage their data while still focusing on what they do best?
That's where KPI dashboards come in. These powerful tools help you track and analyze key performance indicators such as sales, marketing, finance, customer service, and e-commerce. Moreover, they can run it automatically, providing simple graphs and charts to understand the data at a glance.
Creating a KPI dashboard from scratch may appear daunting, but with the proper KPI dashboard templates, you can easily track your data without spending hours poring over spreadsheets. And with the ability to customize your dashboard to fit your specific needs, you can focus on the metrics that matter most to your business.
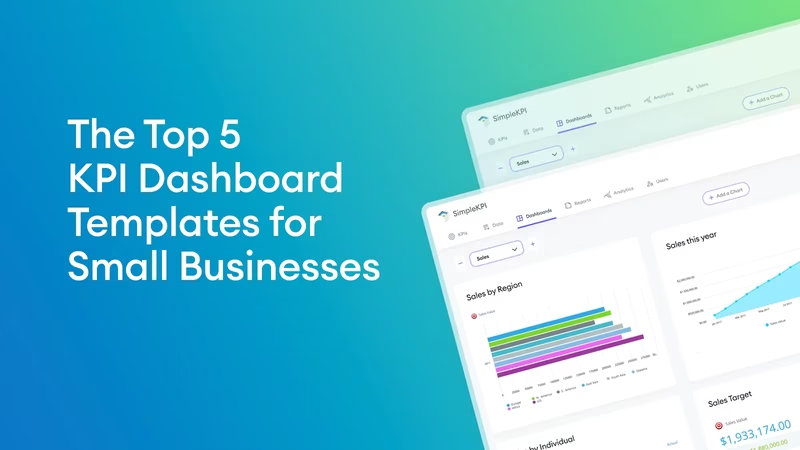
In this article, we'll explore the top 5 KPI dashboard templates for small businesses to help you take your business to the next level.
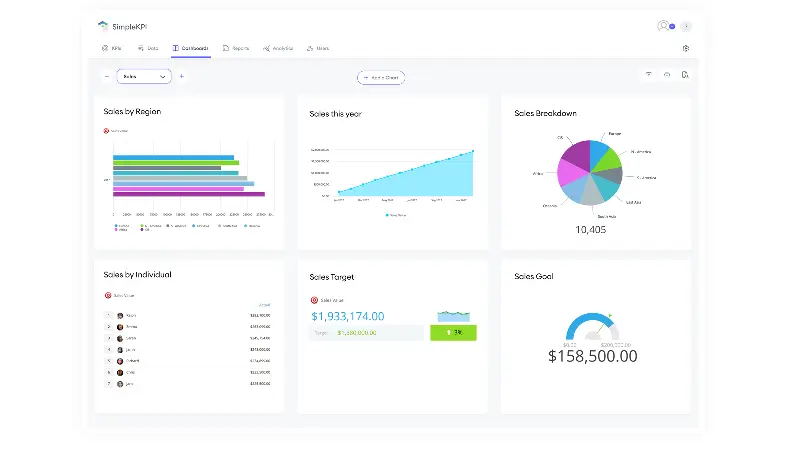
The Sales KPI Dashboard template
This dashboard template measures sales performance and tracks revenue, sales growth, and customer acquisition cost metrics. It helps businesses identify their top-performing products and sales channels and optimize their strategies accordingly.
What kind of KPIs are found on a sales KPI Dashboard template?
Sales Growth
This KPI aims to measure the percentage increase or decrease in sales revenue over a specified period. It helps businesses identify trends in sales performance and adjust their strategies accordingly. For example, a company might use this KPI to track monthly sales growth and adapt its marketing campaigns to increase sales.
Sales Target
This KPI measures the percentage of sales revenue achieved against a predetermined sales target. It helps businesses evaluate their sales performance and identify areas for improvement. For example, a business might set a monthly sales target and track its progress toward that target using this KPI
Customer Acquisition Cost
This KPI measures the cost of acquiring a new customer. It helps businesses judge the effectiveness of their sales and marketing strategies, identifying areas for improvement. For example, a company might use this KPI to track the cost of acquiring new customers through different marketing channels and adjust its marketing budget accordingly.
Average Revenue per Unit
This KPI measures the average revenue generated per unit sold. It helps businesses determine the profitability of their products and services and identify improvement areas. For example, a company might use this KPI to track the average revenue generated per product and adjust its pricing strategy accordingly.
Sales Pipeline Velocity
This KPI measures the speed at which leads travel through the sales pipeline. It helps businesses identify bottlenecks in the sales process and adjust their strategies accordingly. For example, a company might use this KPI to track the average time it takes for a lead to move from initial contact stage to the final sale stage.
You can see a live preview of a Sales KPI Dashboard here.
The frequency of tracking these sales KPIs can vary depending on the business's needs. Some companies might track these KPIs daily, while others might track them weekly or monthly. The key is consistently tracking these KPIs and using the insights to make data-driven decisions.
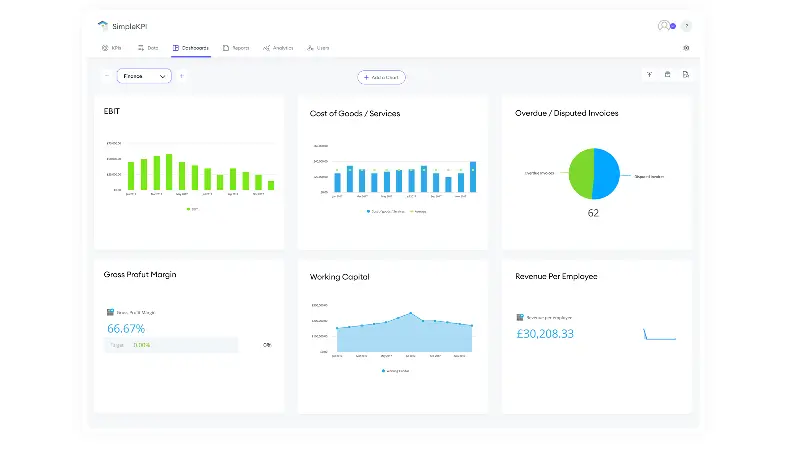
The Financial KPI Dashboard template
This dashboard tracks financial metrics such as cash flow, profit margins, and return on investment (ROI). It helps businesses monitor their financial health and make informed investment, expenses, and pricing decisions.
Revenue per Employee
This KPI measures the revenue generated per employee. It helps businesses evaluate their productivity and identify areas for improvement. For example, a company might use this KPI to track their revenue per employee every quarter and adjust their staffing levels.
EBIT (Earnings Before Interest and Taxes)
This KPI measures a business's profitability before considering interest and taxes. It helps companies to evaluate their operating performance and identify areas for improvement. For example, a business might use this KPI to track its EBIT annually and adjust its pricing strategy.
Cost of Goods Sold (COGS)
This KPI measures the direct cost of producing and delivering a product or service. It helps businesses evaluate their profitability and identify areas for improvement. For example, a company might use this KPI to track its COGS every month and adjust its pricing strategy.
Working Capital
This KPI measures a business's ability to meet its short-term financial obligations. It helps companies to evaluate their liquidity and identify areas for improvement. For example, a business might use this KPI to track their working capital on a quarterly basis and adjust their cash management strategy.
Gross Profit Margin
This KPI measures the percentage of revenue that remains after deducting the cost of goods that are sold. It helps businesses evaluate their profitability and identify areas for improvement. For example, a business might use this KPI to track its gross profit margin on a monthly basis and adjust its pricing strategy.
You can see a live preview of a Finance KPI Dashboard template here.
This financial KPI dashboard template can be an invaluable tool for small businesses. By tracking key financial metrics, companies are able to gain valuable insights into their financial health and identify areas for improvement or savings. With the ability to customize the dashboard to fit their specific needs, small businesses can focus on the metrics that matter most to them.
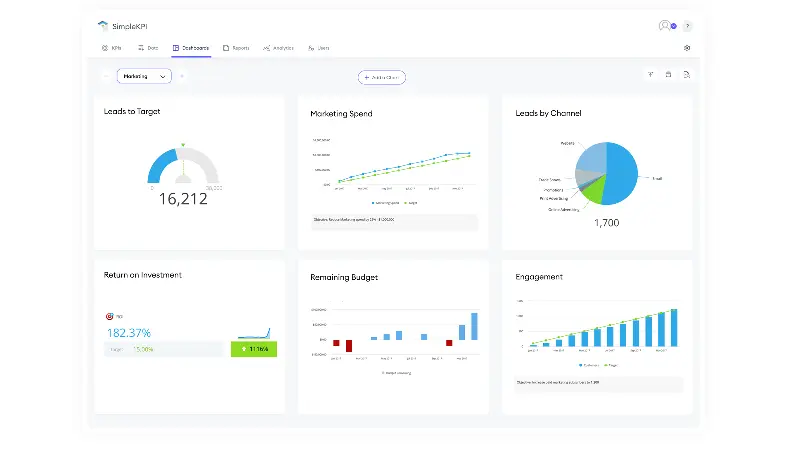
The Marketing KPI Dashboard Template
This dashboard template measures the effectiveness of marketing campaigns and tracks metrics such as marketing leads, lead generation, and conversion rates. It helps businesses identify their most successful marketing channels and campaigns and optimize their marketing strategies accordingly.
Marketing Leads
This KPI measures the number of leads generated by marketing campaigns. It assists businesses evaluate the effectiveness of their marketing strategies and identify improvement areas. For example, a business might use this KPI to track their marketing leads on a monthly basis and adjust their marketing campaigns.
Marketing Spend
This KPI measures the amount of money spent on marketing campaigns. It helps businesses evaluate their marketing efforts' ROI and identify improvement areas. For example, a business might use this KPI to track their marketing spend on a quarterly basis and adjust their marketing budget.
Leads by Channel
This KPI measures the number of leads each marketing channel generates. It assists businesses evaluate the effectiveness of their marketing channels and identify improvement areas. For example, a business might use this KPI to track their leads by channel on a monthly basis and adjust their marketing mix.
Return on Marketing Investment (ROMI):
This KPI measures the return on investment of marketing campaigns. It helps businesses to effectively evaluate their marketing efforts and identify improvement areas. For example, a business might use this KPI to track its ROMI on a quarterly basis and adjust its marketing strategy.
Engagement Rate
This KPI measures the level of engagement with marketing content. It helps businesses judge the effectiveness of their marketing content and identify improvement areas. For example, a business might use this KPI to track its engagement rate on social media and adjust its content strategy.
You can see a live preview of a Marketing KPI Dashboard template here.
A marketing KPI dashboard template can be a handy tool for small businesses. By tracking these KPIs, companies can see their marketing strategies' effectiveness and determine what they need to improve.
Customer Service KPI Dashboard
This dashboard example template tracks customer service metrics such as response time, resolution time, and customer satisfaction. It helps businesses monitor their customer service performance and identify areas for improvement.
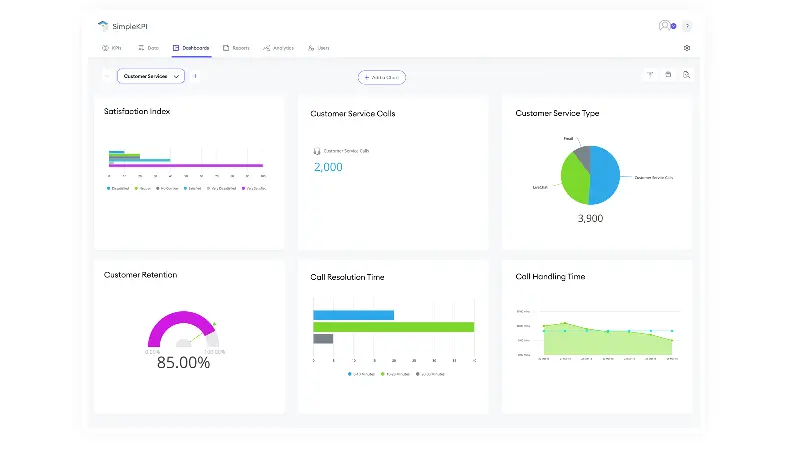
Satisfaction Index
This KPI measures customers' satisfaction with the service they receive. It helps businesses judge the effectiveness of their customer service and identify improvement areas. For example, a company might use this KPI to track its satisfaction index monthly and adjust its customer service strategy.
Service Calls
This KPI measures the number of calls customer service representatives receive. It helps businesses evaluate the volume of customer service requests and identify areas for improvement. For example, a company might use this KPI to track their service calls daily and adjust their staffing levels.
Service Type
This KPI measures the type of service requested by customers. It helps businesses evaluate the types of issues customers are experiencing and identify areas for improvement. For example, a business might use this KPI to track the service types every week and adjust their customer service training.
Customer Retention
This KPI monitors the percentage of customers who continue to procure a business's products or services over time. It helps businesses evaluate their customer loyalty and identify areas for improvement. For example, a business might use this KPI to track its customer retention rate on a quarterly basis and adjust its customer service strategy.
Call Resolution Time
This KPI measures the length of time it takes to resolve a customer service call. It helps businesses evaluate the effectiveness of their customer service representatives and identify areas for improvement. For example, a business might use this KPI to track their call resolution time daily and adjust their customer service training.
You can see a live preview of a Customer Services KPI Dashboard template here.
The E-commerce KPI Dashboard
This dashboard measures e-commerce performance and tracks website traffic, conversion rates, and average order value metrics. It helps businesses identify their top-performing products and sales channels and optimize their e-commerce strategies accordingly.
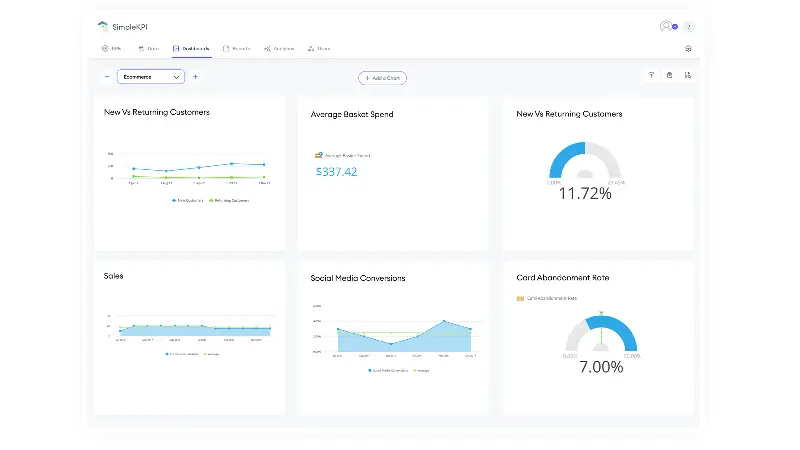
Cart Abandonment Rate
This KPI measures the percentage of shoppers who add items to their cart but do not complete the purchase. It helps businesses evaluate the effectiveness of their checkout process and identify improvement areas. For example, a business might use this KPI to track their cart abandonment rate on a monthly basis and adjust their checkout process.
New Vs. Returning Customers
This KPI measures the percentage of new customers versus returning customers. It helps businesses evaluate their customer acquisition and retention strategies and identify areas for improvement. For example, a business might use this KPI to track their new vs returning customers on a quarterly basis and adjust their marketing strategy.
Average Basket Spend
This KPI measures the average amount spent per transaction. It assists businesses evaluate the profitability of their products and services and identify improvement areas. For example, a business might use this KPI to track their average basket spend on a monthly basis and adjust their pricing strategy.
Sales
This KPI measures the total amount of revenue generated from sales. It helps businesses evaluate their overall e-commerce performance and identify areas for improvement. For example, a business might use this KPI to track its sales on a monthly basis and adjust its marketing strategy.
Social Media Conversions
This KPI measures the number of conversions generated from social media campaigns. It helps businesses evaluate the effectiveness of their social media campaigns and identify areas for improvement. For example, a business might use this KPI to track their social media conversions on a monthly basis and adjust their social media strategy.
You can see a live preview of a E-commerce KPI Dashboard template here.
Finally
KPI dashboards are an excellent way for small businesses to track their performance and make those data-driven decisions. Businesses can use a blend of the top 5 KPI templates to evaluate different aspects of their operations, from sales performance to customer service. These templates offer small businesses the freedom to run their business while taking advantage of the opportunities and insights from the data they generate. Check out this resource if you're looking for even more KPI dashboard examples.

by Stuart Kinsey
Stuart Kinsey writes on Key Performance Indicators, Dashboards, Marketing, and Business Strategy. He is a co-founder of SimpleKPI and has worked in creative and analytical services for over 25 years. He believes embracing KPIs and visualizing performance is essential for any organization to thrive and grow.