Recent years have seen immense growth in the functionality and popularity of KPI software solutions, and, for all its many problems, 2020 proved to be a big year for this field.
With almost ubiquitous access to cloud applications for businesses and individuals alike, there was perhaps never a better time in our history for large numbers of people to be forced to work from home. And, thanks to the advent of things like big data and cloud computing, many businesses have found benefits in KPI software that they might not have discovered as quickly without the pandemic to force their hand.
Businesses that were once stuck in a world of spreadsheets have moved to KPI reporting solutions, and KPI software in turn has evolved to meet the demands of a rapidly growing number of small businesses and freelance individuals with smaller, agile applications and services.
The growth of solutions based around key performance indicators is not over, of course. Armed with the insights gained throughout 2020, we now look to 2021, and what the future might bring. To that end, we've put together a list of some of the biggest trends in KPI software, and what they might mean for the future.
Even Bigger Data
The concept of big data as we recognize it today is not particularly new, having been around since the early 2000s, but the "big" part of big data was never quite as emphatic as it is today.
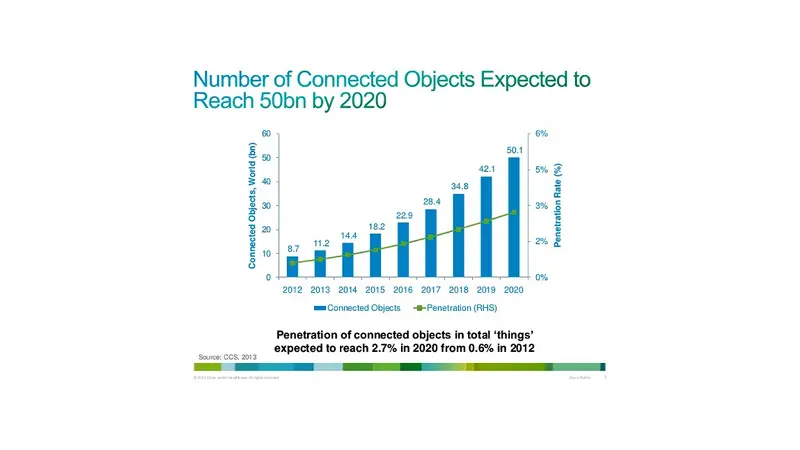
The increasing torrent of information that businesses are having to deal with daily has increased the need for innovative and efficient ways of managing big data at all stages, including collecting it, storing it, accessing it, and analyzing it. And, with every technological innovation, there seem to be more data points created, increasing that flood of information. Business machinery comes loaded with even more sensors, people wear more "smart" technology, phones are released with additional data recording features, more devices around the home join the Internet of Things.
Fortunately, with the relentless march of progress in the world of computing power, not to mention the explosion of innovation in the world of artificial intelligence (more on that later), handling all of this data is well within the remit of KPI software.
Perhaps the most glamorous aspect of all of this-certainly the most obviously useful to the end user-is the use of big data visualizations to disseminate all of this information in ways that are accessible to a far greater range of people. The benefits of this are far-reaching, from providing experts with a simple way of illustrating data-based analysis to the management, to allowing customers a way of directly seeing relevant data understandably without having to spend time and money on making the data accessible.
Going forward, we can expect to see the capabilities of big data continue to expand, though there is a very real risk of "bottle-necking" innovation. As much as the ability to handle big data is improving, it is not yet certain that it will be able to keep up with the amount of additional data being created.
Security, Security, and More Security
The availability (and subsequent collection and storage) of more data has led to many benefits for businesses and individuals alike. Being able to instantly access the information you need from your mobile phone has undeniable benefits from a convenience standpoint. However, there is another side to that coin; security.
The more data you have out there, the more damaging a data breach can potentially be. That is why data security has been a major priority for businesses and the companies that provide their software and services, and why the demand for security products has continued to increase year-on-year, though it slowed somewhat last year due to the pandemic.
In addition to the pure safety of data, issues of privacy have come to the forefront of big data. Issues that have led the European Union to push through legislation to protect EU citizens' data from being collected by countries outside of the EU without express individual consent.
This has and does pose problems from a cloud computing perspective since one of the main advantages of cloud services is that the data can be anywhere. Given the number of SaaS providers based in America, it can be tricky for European companies to find a provider that will not cause potential headaches due to them not being based in the EU, as the transfer of data between the EU and the US would be technically illegal without additional steps, adding expense and time.
Much of the fine detail of these regulations is untested from a legal standpoint, and we can expect to see that uncertainty cleared up in the not too distant future as businesses challenge the practicality of some aspects of data privacy regulations.
Perhaps one of the biggest innovations in recent years, artificial intelligence has finally arrived, and it is finding usefulness in just about every corner of our technological society. Of course, the world of KPI software is no exception.

The form artificial intelligence takes may not be the way it was predicted in the countless science fiction works that have explored this premise, but that has not stopped it from being incredibly useful, with automation being one of the more significant tools it can provide.
Thanks to the ability of these very specialist AIs-which can "learn" to perform very specific tasks-things that would once have only been possible with human intelligence at the helm can now be completed by software.
In the world of KPI reporting, AI is incredibly useful in assisting with the masses of data that we talked about earlier. Traditional software can be programmed to recognize things that may be problematic, but AI can continuously monitor for anomalies, even when what constitutes an anomaly changes over time. It can also be used to make predictions based on historical trends, provide insights on your business based on the wealth of available data, and present it all in a visual and accessible form that does not need a degree in analytics to understand.
Dashboards on the go
It's no secret that handheld technology has come leaps and bounds in the last decade. It wasn't even fifteen years ago that the pinnacle of mobile phone technology still included physical keyboards, small screens, and apps that were non-existent in the sense of what we're used to today.
Now, however, mobile phones are veritable supercomputers by not-too-distant standards, with the ability to display rich detail in crystal clarity, and interact with things smoothly and intuitively. What's more, with a slew of device form factors available-tablet computers, laptops, even smart watches-there are more portable ways to access the vast array of services that technology has gifted us than ever before.
This is why there has been a huge increase in the number of KPI dashboards available to business devices, allowing users to access KPI reports, big data analysis, and many other crucial components of modern business. Having access to these things, not just on the go, but in a way that is intuitive and clear, makes staying on top of developing issues easier than ever. Supply chain management, for example, has never been as handily managed as it is now, with up-to-the-minute information from across the entire supply chain being accessible at the touch of a screen.
We can expect to see this trend to continue, with many software as a service (SaaS) providers working hard on making their mobile dashboards as clean and easy to use as possible. There may come a time when the need for computers in the traditional sense is all but eradicated, and the entirety of a business’s digital footprint is built around mobile dashboards and cloud services.
More Predictive features
Data analysis is not new, of course. Ever since the concept of business was a thing, business owners have employed predictive analysis to some degree or another. For example, tavern owners deciding how much ale to purchase by guessing how much they will need based on past sales.
While prescriptive analysis starts with the desired outcome and works backwards, offering insights on the best ways to achieve that goal. Predictive analysis looks at past data to infer the most likely future.
Things have come a long way in the world of predictive analysis, however, and tools (such as the aforementioned AI) can be used to quickly and accurately make predictions based on the available data, something that we expect to become more common going forward.
It is through using advanced predictive analysis that KPI reporting tools can offer useful insights into the way a business or department is being run, which will prove invaluable to smaller business owners and individual freelancers who would not have previously had access to this kind of analytical power without paying large sums of money.
Data without the lag
The ability to access real-time data has been revolutionary in business. Stretching as far back as the earliest instances of interconnected computers in the corporate world, instantly accessible data has expanded to become increasingly frictionless. And, with the ever-growing number of data points at our disposal, as well as the means to collect that data instantaneously, it is increasingly common for up-to-the-second data to be available.
Not only does this have a significant impact on the pace at which business can progress, it also has profound implications for the accuracy of decision-making. With every part of a business working from the same data, and that data being effectively "live", there are far fewer instances of mistakes being made as a result of "crossed wires" or mixed messages.
Real-time data also creates an environment in which businesses can get ahead of potential problems before they cause too much damage. To use the example of a supply chain once more; the earlier you learn of a problem with a supplier, the sooner you can find a solution to compensate for that problem. In a modern SaaS-based system, the supplier would be able to register any issues quickly, and that information would immediately be available to the rest of the supply chain.
We anticipate the speed at which data is consumed and translated into simple, understandable visuals through graphs and charts to increase rapidly this year.
Automation and Integration
One of the negative side effects of the overwhelming amount of data we have at our disposal these days is the fact that it is impossible to analyze it all via any conventional means. For larger organizations, the sheer speed at which data is collected would rule out any practical solution that involves humans analyzing the data.
We have already covered the fact that advanced software and AI solutions can analyze vast quantities of data far more effectively than we mere humans can, but another benefit of this is the ability to automate the procurement of that data.
In the past, data would have to be manually entered into any computer systems (or even older hard copy systems) but the interconnected nature of our computer systems and software in 2021 and beyond will ensure that the amount of data that needs to be entered into any system manually is reduced significantly, if not eradicated altogether, since the data can enter the system directly from the source.
The days of keeping paper records and having someone type the information in those records into a computer are fading away, and they're not likely to make a comeback anytime soon. Expect to see more integration between data sources and KPI systems.
Final Thoughts
The efficient handling of data is already integral to large organizations and is becoming increasingly important to smaller businesses and individuals. As we head into 2021 and beyond, we can expect to see key performance indicator software take an increasingly central role in the utilization of that data; managing, analyzing, and visualizing data in ways and on scales that have not been possible before. We can expect to see more of these capabilities placed in the palm of our hands with mobile dashboards. And we can expect advanced techniques like AI to provide increasingly useful insights.

by Stuart Kinsey
Stuart Kinsey writes on Key Performance Indicators, Dashboards, Marketing, and Business Strategy. He is a co-founder of SimpleKPI and has worked in creative and analytical services for over 25 years. He believes embracing KPIs and visualizing performance is essential for any organization to thrive and grow.