
In this Article:
- What is a Production KPI?
- Why are Production KPIs so important?
- Different Types of Production KPIs
- The best 21 Production KPIs
- Production KPIs on Dashboards and Reports
What is a Production KPI?
A Production Key Performance Indicator (KPI) is a specific type of measure found in the manufacturing industry used to evaluate the performance of the production process.
Manufacturing companies will typically use these KPIs to help track and improve their production through dedicated KPI Reporting. They provide insight into the manufacturing process that allows both management and operators to reach production goals.
This article will provide an overview of the best 21 production KPIs. It will cover how to choose and implement them for your production process, with examples and formulas for you to use freely. You can also see examples of these KPIs on dashboards and reports.
Why are Production KPIs so important?
In an increasingly competitive manufacturing industry, production is king. The process must be efficient, flexible, and above all else, innovative.
The pressures for manufacturing companies to deliver faster and newer requires them to set and monitor goals efficiently. And this is where production KPIs play their part.
Production KPIs are used to consume a vast and varied amount of metrics into a manageable and measurable number of Key Performance Indicators - providing the company with a platform to react quicker to environmental changes, forecast demand, and provide insights into risks and opportunities.
Different types of Production KPIs
Production KPIs can be categorized into three distinct areas.
Machinery or Asset Focused
Those KPIs that are primarily responsible for monitoring the machinery include the machine uptime rate, which measures the time the machine is maintenance-free and working as expected. They also cover defects and changeover time (time taken to set up the machine for another product line).
Unit or Product Focused
KPIs that are focused on the products that are produced, such as the unit rate, throughput, and cycle rate, fall into this category.
Cost Focused
Costs that are attributed to the production process, such as avoided costs, staffing costs, or raw material costs would fall into this category.
The best 21 Production KPIs
1. Cycle Time
Measuring the speed or time it takes to finish a product from start to completion is called ‘Cycle Time.’ Its primary function is to provide a clear understanding of the efficiency of the production process. Typically Cycle Time will cover the complete production cycle, sometimes including various product elements produced over different machines or locations.
Formula: Cycle Time = Production End Time – Production Start Time.
Goal Example: Decrease Cycle Time to under 3 hours by Jan 2022.
2. Throughput Rate
Throughput rate refers to the number of units, materials, items, or finished products passing through a process. For example, in the manufacture of screws, it would be the number of units produced in an hour. Measuring throughput rates gives you a good indication of whether you can meet demand, as well as an indication of process efficiency.
Formula: Throughput Rate = Number of Units Produced / Time.
Goal Example: Increase Throughput by 10% in the next quarter.
3. Production Attainment
Measuring the degree to which the production process reaches its target output is known as ‘Production Attainment.’ This KPI can indicate a potential issue with machinery, planning, or defects that negatively impact the rate. The aim of improving this rate can have cost and quality benefits.
Formula: (Number of Units Produced / Target Units Produced) * 100.
Goal Example: Increase Attainment rate by 5% quarter on quarter.
4. Machine Uptime Rate
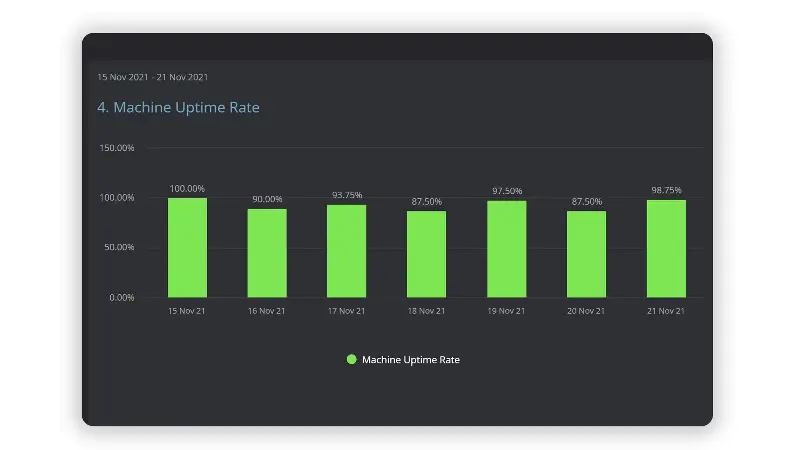
As the machinery for most manufacturing industries is a key element of the production process, monitoring the uptime of these machines is vital for efficiency. Inadequate performance can indicate poor maintenance, slow changeover times, or machinery defects that must be addressed.
Formula: (Total Time Machine Used / Available Production Time) * 100.
Goal Example: Ensure each machine uptime rate is 90%.
5. Production Capacity Rate
Production Capacity refers to the maximum output that can be achieved. Understanding the production capacity allows you to plan production schedules better, which provides better lead times.
Formula: Machine Capacity Rate * Time.
Goal Example: Increase Production Capacity Rate to X% by Y date.
6. Unit Maintenance Cost
To understand how the number of units produced affects your maintenance costs, you can use the Unit Maintenance Cost. This can be applied to an individual machine or several machines producing the same unit. It provides a fundamental understanding of the impact that producing a number of units has on the costs to maintain the machines.
Formula: Total Maintenance Cost / Number of Units Produced.
Goal Example: Reduce Unit Maintenance costs by 5% this year.
7. Defect Rate
Defect rate is considered one of the most crucial manufacturing KPIs. This is due to the KPI offering insight into various elements that may increase or reduce the rate. For example, analyzing the defect rate per shift may highlight management issues, whereas studying the defect rate by machine may unearth maintenance issues that need resolving.
Formula: (Number of Defects / Units Produced) * 100.
Goal Example: Reduce Defect Rate to <1%.
8. Production Cost per Unit
Understanding the total production cost per unit produced provides you with a final cost for pricing the product. This KPI also provides a price base for modelling the impact of different materials on the final cost. The total manufacturing costs entail collecting data from other metrics such as materials, infrastructure, workforce costs, and overheads.
Formula: Total Manufacturing Cost / Number of Units Produced.
Goal Example: Lower the unit production cost by 2 cents by 2022.
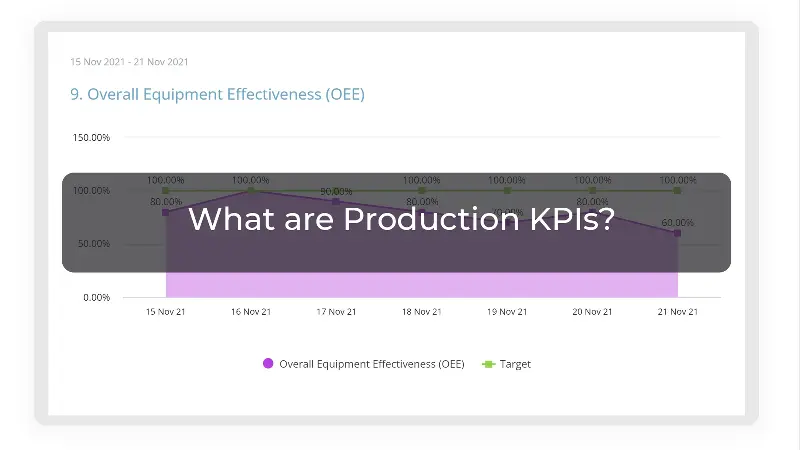
9. Overall Equipment Effectiveness (OEE)
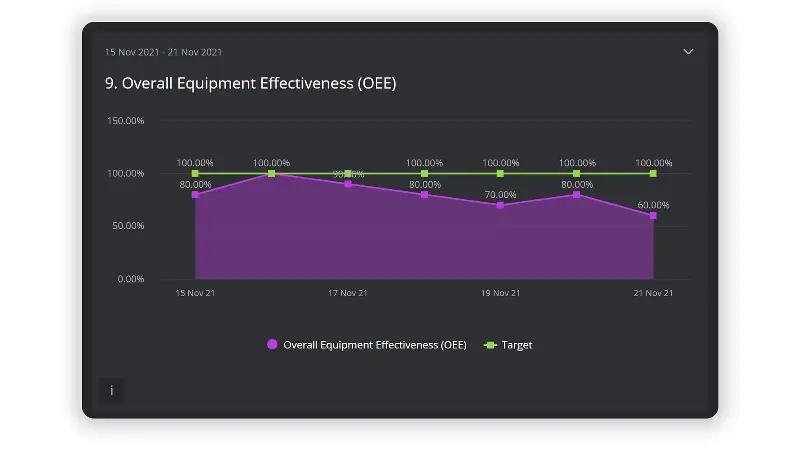
Overall Equipment Effectiveness (OEE) measures a machine’s or production platform’s level of productivity. It combines the three key elements together:
- Availability: How often the machine is available during its planned time.
- Performance: How many units the machine can produce (relative to its design capacity).
- Quality: How many defect-free units the machine produces.
A score of 100% for this KPI would assume that the machine was always available, produced the maximum number in that time, and without defects.
Formula: (Units Produced × max Cycle Time) / Available Production Time.
Goal Example: Increase OEE by 5% this year.
10. Avoided cost
This KPI provides an estimated cost saving by comparing preventative maintenance costs to the sum of assumed machine repair costs and associated downtime costs from lost production.
It justifies implementing ongoing maintenance best practices.
Formula: (Assumed Repair Cost + Production Losses) – Preventative Maintenance Cost.
11. Unused Capacity Cost
When machines aren’t running to their capacity, staff are not utilized, or materials are unavailable, these all contribute to additional costs in the manufacturing process. The Unused Capacity Cost tracks a combination of these unplanned costs into a single value.
Formula: Percentage of available unused capacity × Total Manufacturing Cost.
Goal Example: Reduce unused capacity by 10% over 6 months.
12. Capacity Utilization
Assessing the rate at which potential output rates are met or not is known as Capacity Utilization. This lets manufacturing companies align the number of units produced with a percentage of potential that can be measured.
Formula: (Units Produced / Potential Number of Units That Can Be Made) * 100.
Goal Example: Increase Capacity Utilization by 2% month on month.
13. Takt Time
Takt Time is a KPI that allows you to ensure a lean and efficient production process from the customer order to the final delivery. It is designed to optimize your capacity when demand fluctuates, for example, in the automotive industry.
Formula: Available Production Time / Average Customer Demand.
14. Material Usage
Comparing the actual material needed to make a product versus the planned material is known as Material Usage. This KPI provides manufacturing companies with a quantifiable number to assess why there are fluctuations in material usage and address those issues to reduce costs.
Formula: Materials Used / Materials Planned *100.
Goal Example: Reduce the amount of material overuse this quarter.
15. Products in Process / Work in Progress
Products in Process, also known as Work-in-Process, is a production KPI that helps manufacturing companies estimate the value of products currently in the production process. This KPI is used for both monitoring and accounting purposes.
Formula: Beginning Work in Process + Production Costs – Cost of Goods Manufactured
16. Production Forecasting / Demand Forecasting
Production Forecasting, also known as Demand Forecasting, is used to provide an estimate for acquiring raw materials to meet future demand.
Formula: Materials * Production Rate.
17. Overtime hours
Tracking and analyzing the amount of overtime versus regular planned hours can provide insights into scheduling and production issues.
Formula: Overtime Hours/ Planned Hours * 100.
Goal Example: Reduce the reliance on overtime hours by 3% this year.
18. Mean time between failure (MTBF)
Mean Time Between Failures (MTBF) is a maintenance-focused KPI that measures the amount of time between failures. The trend it provides allows manufacturing companies to estimate the scheduled maintenance needed for their production assets. It can also be used to estimate the lifespan of machines and production assets.
Formula: Available Production Time / Total Number of Failures.
Goal Example: Increase the MTBF by 1,000 hours this quarter.
19. Planned Maintenance Percentage (PMP)
Planned Maintenance Percentage helps manufacturing companies determine the maintenance to machinery and assets over and above the scheduled maintenance. This KPI is used to assess and optimize the current maintenance strategy. It also provides insight into the lifespan of those assets.
Formula: Scheduled Maintenance Hours / Total Number of Maintenance Hours * 100.
20. Changeover Time
Changeover Time is a KPI used in the production process to determine the time it takes to retool, calibrate or reload an asset to start a new unit.
This KPI can be used to optimize the time taken to changeover, therefore reducing downtime, or it can be used to optimize the order of jobs to improve estimates and delivery times.
Formula: Available Production Time – Actual Production Time.
21. Waste Reduction Rate
The waste reduction rate is a KPI that determines the rate at which an organization is either reducing or increasing waste in the production process. The measure is presented as a percentage aimed at reducing waste for both financial and environmental reasons.
Formula: Materials Used / Waste Material * 100.
Goal Example: Reduce waste by X% this quarter.
Production KPIs on Dashboards and Reports
The manufacturing process is capable of producing vast amounts of data and metrics. Some of those metrics will be independent such as the number of units produced, and some will be used within KPIs to track performance. Without being able to translate this data to be more ‘usable,’ manufacturing companies then risk the almost inevitable outcome of slow decline and decreased demand for products, ultimately resulting in loss of market share and dwindling profitability.
To translate this raw data to be meaningful and insightful, you will need dedicated KPI dashboards and reports.
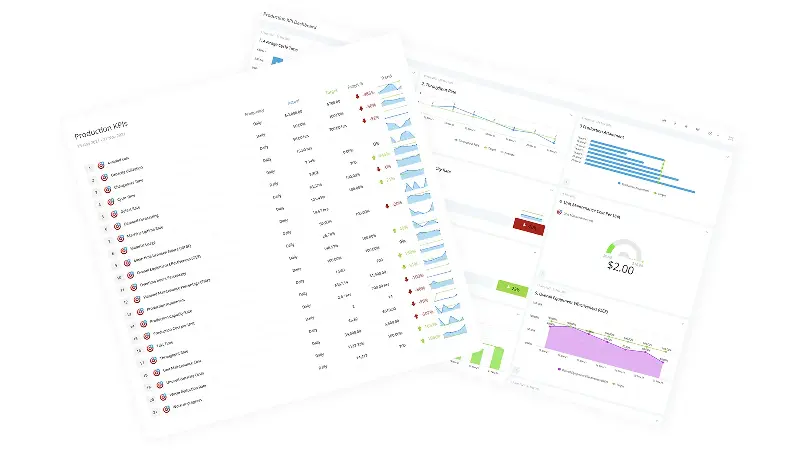
Most assets in production currently have some reporting, but it is usually isolated from the other data required to create the KPIs needed to monitor and improve performance.
The advantage of KPI dashboards and reports is not only being able to automatically pull this data from various sources but also to visualize your KPIs in easy-to-understand graphs and charts.
Some of these dashboards will serve as management information tools to improve performance, and others will serve as production aids where operators can see the performance of the manufacturing process in real-time.
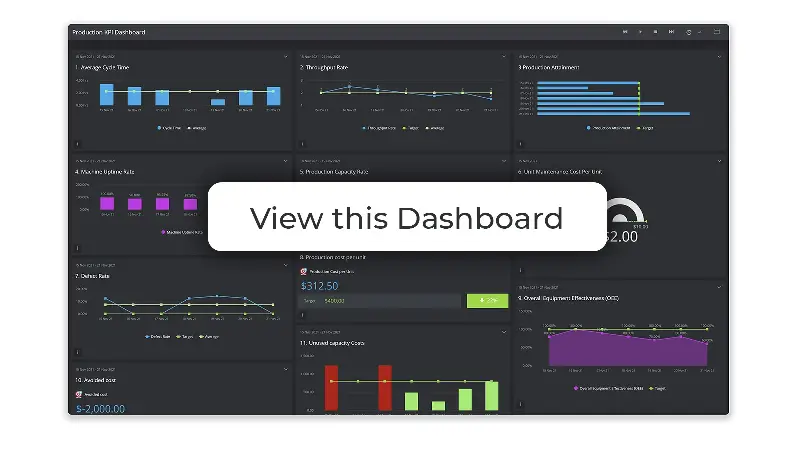
To see how these 21 KPIs can be visualized and displayed on KPI dashboards, we have created an example production KPI dashboard for you to explore.

by Stuart Kinsey
Stuart Kinsey writes on Key Performance Indicators, Dashboards, Marketing, and Business Strategy. He is a co-founder of SimpleKPI and has worked in creative and analytical services for over 25 years. He believes embracing KPIs and visualizing performance is essential for any organization to thrive and grow.