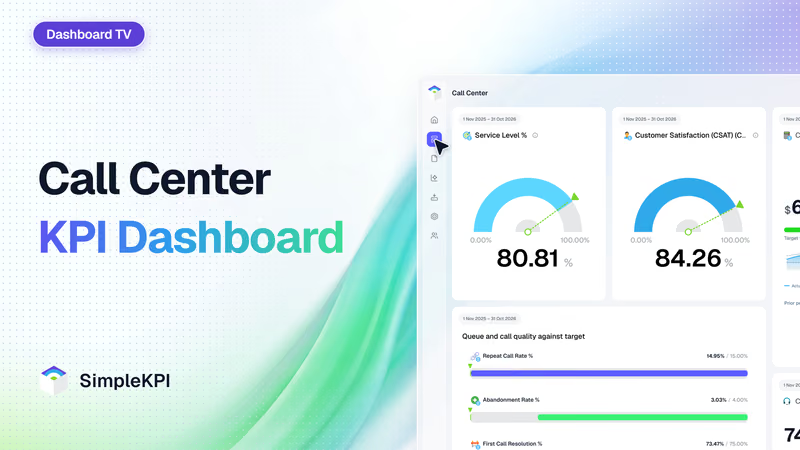
Call Center Performance Dashboard
Every January the price-change letters go out, and a week later the phones show it. In January 2025 this call center took 64,844 calls. It answered barely half of them within 20 seconds, and one caller in ten hung up before an agent picked up.
The fix most call centers are reaching for is an AI voice agent. In March 2025 Gartner predicted that by 2029 agentic AI will resolve 80% of common customer service issues without human intervention, leading to a 30% reduction in operational costs.
Callers aren't convinced. In a Gartner survey of 5,728 customers, 64% said they'd prefer that companies didn't use AI in customer service. Their top concern was that it would get harder to reach a person.
This example follows an invented company through both sides of that argument: a regional internet provider that put an AI voice agent on its main phone line in June 2025.
The short version: the voice agent cut the queue within weeks. But the company judged it on containment alone, and for five months that number hid callers who were giving up and calling back.
None of the figures belong to a real business: they're modeled. Six of the KPIs below are compared with a published figure, and the table says which.
What is a Call Center KPI Dashboard?
Overview
A call center KPI dashboard shows how many calls arrive, how many are finished without an agent, how quickly the rest are answered, how long they take, whether the problem was fixed on that call, and what each call costs.
It follows a call from the first ring. Calls offered is the demand. Containment rate is the share the phone menu or an AI voice agent finished without a person. Repeat call rate checks that work: a caller who calls back within a week wasn't helped the first time.
Then the queue. Service level is the share of calls answered within a set number of seconds, here 20. Average speed of answer and abandonment rate describe the same wait from two other angles: how long the typical caller held, and how many gave up.
Then the conversation. Average handle time is how long a call takes an agent, including the notes afterwards. First call resolution asks whether that call fixed the problem.
Agent occupancy sits behind all of it. It's the share of logged-in time agents spend on calls, and it shows whether the team can keep going at this pace. Customer satisfaction and cost per call are the result.
Who benefits from this dashboard?
- Call Center Director: Service level, CSAT and cost per call on one screen show whether the budget is buying a phone that gets answered.
- Workforce Planner: Calls offered, handle time and occupancy are the inputs to next month's schedule. When handle time moves, the number of agents needed moves with it.
- Whoever owns the voice agent: Containment rate and repeat call rate together show whether a new automated task is helping callers or trapping them.
- Team Leads: First call resolution shows where coaching is needed. It's a fairer measure of an agent than how fast they get off the phone.
- Finance: Cost per call and total monthly cost, read together, show what automation saved and where the saving went.
Never show containment rate without repeat call rate beside it. A phone menu that makes it hard to reach a person scores well on containment and sends the same callers back the next day.
Dashboard Example Overview
The company sells fiber and cable internet to homes and small businesses across three Midwestern states.
Its call center is one site with 60 agents at the start. It takes between 54,000 and 70,000 calls a month about bills, outages, technician appointments and faults. It reports monthly against eleven KPIs:
- Calls Offered: Every inbound call that reaches the main line.
- Containment Rate: Calls finished by the automated system, divided by calls offered. That's a touch-tone menu until May 2025 and the AI voice agent from June.
- Repeat Call Rate: Calls from a number that also called in the previous seven days, divided by calls offered.
- Service Level: Calls answered by an agent within 20 seconds, divided by calls queued for an agent. Callers who hang up in the first five seconds are left out. ICMI's guide to contact center metrics lists 80/20 among its moderate service level objectives, and that's the target here.
- Average Speed of Answer: The average time answered callers waited in the queue, in seconds.
- Abandonment Rate: Calls abandoned in the queue, divided by calls queued for an agent.
- Average Handle Time: Talk time, hold time and after-call work, divided by calls answered. In minutes.
- First Call Resolution: Agent-handled calls with no further call from the same number about the same issue within seven days, divided by calls answered.
- Agent Occupancy: Hours spent handling calls, divided by hours logged in.
- Customer Satisfaction (CSAT): Survey responses scoring 4 or 5 out of 5, divided by responses. The same one-question survey follows calls handled by the voice agent and by agents.
- Cost per Call: Everything the call center costs in the month (agents, supervisors, telephony, software, the voice agent and the building), divided by calls handled by the voice agent or an agent.
Before the voice agent: a queue that's too slow
Start with the seven months before the voice agent, November 2024 to May 2025.
Callers reach an old touch-tone menu. It takes card payments and plays outage messages, which finishes 10.5% of calls. Everyone else waits for an agent.
They wait too long. The center answers 68.0% of queued calls within 20 seconds, against a target of 80%. The average caller holds for 67 seconds, and 6.3% hang up first.
January is the worst of it.
The price-change letters bring 64,844 calls. Service level falls to 54.7%, and 9.8% of queued callers abandon.
Agents spend 91.0% of their logged-in time on calls.
That last number matters. ICMI's Brad Cleveland writes that when occupancy stays above the low 90% range for extended periods, agents begin to burn out. By February the center is down to 58 agents.
June 2025: the voice agent arrives
In June 2025 the company puts an AI voice agent on the main line.
Callers say what they need. The voice agent can take a payment, explain a bill and log an outage. Everything else goes to a person.
The queue numbers improve within weeks.
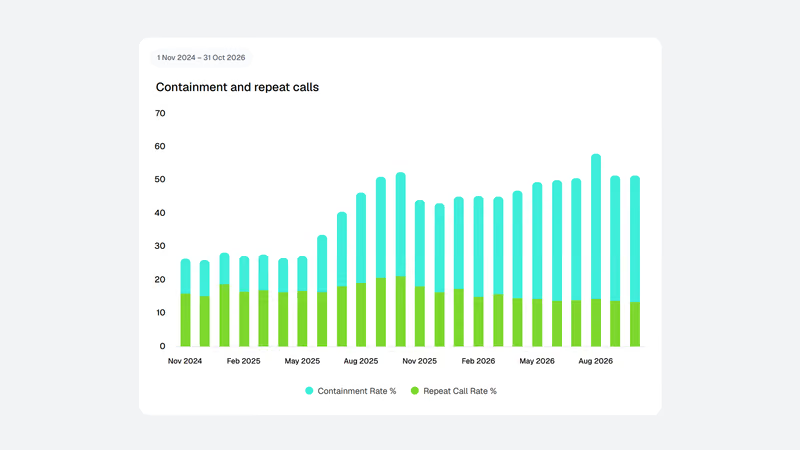
Containment climbs from 17.2% in June to 31.3% in October. Nearly a third of calls no longer reach the queue.
Service level rises from 70.7% to 86.0%, and abandonment falls to 1.9%.
The company stops replacing agents who leave. By October there are 55.
On the queue charts, the center has never looked better.
Three numbers disagree
Over the same five months, three other numbers go the wrong way:
- Repeat call rate rises from 16.3% in June to 21.1% in October.
- First call resolution falls from 71.7% to 66.8%.
- CSAT falls from 81.4% to 74.8%.
The cause is one setup decision. To push containment up, the voice agent offered a person only after a caller had tried twice.
Callers who wanted a person hung up and called again. The share of calls that ended inside the menu nearly doubled, from 3.8% to 7.2%.
Others gave up asking and took what the voice agent could offer. That counted as a contained call, whether or not it was the help they wanted.
The ones who did get through arrived annoyed, with a problem the agent had to hear from the start.
November 2025: the honest figure
At the end of October the company changes the rule. A caller can say "agent" at any point and is transferred, with the account and the reason already on the agent's screen.
Containment drops to 26.1% in November. That's the honest figure.
It also sends 41,805 calls to the queue, up from 36,440, to a team that has shrunk to 54.
Service level falls from 86.0% to 70.9% in a month.
The center had staffed for a containment number that wasn't real.
So it hires. There are 58 agents by January 2026.
January's price letters still hurt: 65,606 calls and a service level of 67.1%. A year earlier the same letters had meant 54.7%.
By February service level is 86.2%, repeat call rate is down to 14.8% and CSAT is 83.6%.
2026: containment grows one task at a time
From there containment grows the slow way, one task at a time.
In February 2026 the voice agent learns to reschedule technician appointments. In May it starts giving outage status by address.
Containment is 30.4% in February and 35.1% in May.
Two outages show the difference.
In March 2026 a fiber cut brings 64,490 calls. The voice agent can't yet tell a caller whether their street is affected, so those calls go to the queue. Service level is 75.8% and abandonment 4.6%.
In August a regional outage brings 69,790 calls, the busiest month of the two years. This time the voice agent answers the outage calls itself.
Containment reaches 43.6%. Service level holds at 79.0% and abandonment at 3.3%.
Where it ended up
Set October 2026 beside October 2025, the last month of the two-tries rule.
| KPI | October 2025 | October 2026 |
|---|---|---|
| Containment Rate | 31.3% | 38.2% |
| Repeat Call Rate | 21.1% | 13.2% |
| Service Level | 86.0% | 87.3% |
| First Call Resolution | 66.8% | 76.3% |
| Customer Satisfaction (CSAT) | 74.8% | 86.7% |
Containment is higher than it was under the old rule, and this time the other numbers agree with it. The average wait is 9 seconds.
Two results that look wrong
Average handle time rose from 8.6 minutes to 10.1.
Nothing is broken. The short calls are the ones the voice agent took, and what's left for agents is the fault that needs diagnosing and the bill that needs explaining.
And the saving is smaller than the forecasts.
Over the last six months, cost per call is $6.78, against $7.53 before the voice agent. That's 10% lower.
But the center's monthly cost is 2.5% higher, and it has 57 agents where it had 60.
The center was understaffed to begin with. Most of what the voice agent freed up went into answering the phone on time: service level of 83.9% against 68.0%, and occupancy of 83.9% against 87.9%.
It also handles 14% more calls a month than it did.
Creating a Call Center Dashboard in SimpleKPI
-
Step 1 Write down what counts
Decide once what "contained" means, when the service level clock starts and how long the repeat-call window is. Here a call is contained when the task is finished in the menu, the clock starts when the call joins the agent queue, and a repeat is seven days. Phone systems differ on all three, so write the choices next to each KPI.
-
Step 2 Enter counts, not percentages
Enter calls offered, calls finished by automation, calls queued, calls answered within 20 seconds, abandoned calls, handle hours and logged-in hours from the phone system's monthly report. Build each rate as a calculated KPI from those counts, with Calculate by set to Total. A quarter is then total answered in time divided by total queued, not an average of three months of different sizes.
-
Step 3 Put containment and repeat calls side by side
Chart containment rate and repeat call rate on the same tile, or next to each other. Every time the voice agent takes on a new task, both should be checked the following month. If they rise together, the new task is sending callers round again.
-
Step 4 Track handle time and occupancy without targeting agents on them
Give average handle time no target, so it never shows red. Give occupancy a ceiling in place of a goal. Both are planning numbers. The numbers to judge the team by are service level, first call resolution and CSAT.
List of Call Center KPIs
Where a published figure exists, the table names it. The other targets are this example's starting points, so replace them with your own history.
| KPI Name | Typical Target | Description / Calculation |
|---|---|---|
| Calls Offered | n/a | All inbound calls reaching the main line in the month. |
| Containment Rate | ≥ 35% (starting point) | Calls finished by the menu or voice agent ÷ calls offered × 100. |
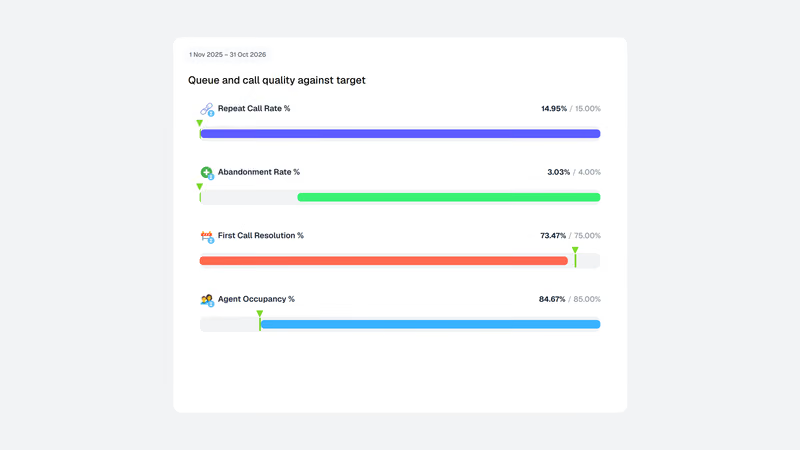
| Repeat Call Rate | ≤ 15% (starting point) | Calls from a number that called in the previous 7 days ÷ calls offered × 100. |
| Service Level | ≥ 80% in 20 seconds (ICMI lists 80/20 as a moderate objective) | Calls answered within 20 seconds ÷ calls queued for an agent × 100. |
| Average Speed of Answer | ≤ 20 seconds (APQC median: 15.0 seconds) | Total queue wait of answered calls ÷ calls answered. |
| Abandonment Rate | ≤ 4% (APQC median: 4.0%) | Calls abandoned in the queue ÷ calls queued for an agent × 100. |
| Average Handle Time | No target (APQC median: 590 seconds) | (Talk time + hold time + after-call work) ÷ calls answered. |
| First Call Resolution | ≥ 75% (starting point; APQC phone median: 80.0%) | Answered calls with no repeat about the same issue within 7 days ÷ calls answered × 100. |
| Agent Occupancy | ≤ 85% (a ceiling, not a goal) | Handle hours ÷ logged-in hours × 100. |
| Customer Satisfaction (CSAT) | ≥ 85% (starting point) | Survey responses scoring 4 or 5 out of 5 ÷ survey responses × 100. |
| Cost per Call | ≤ $7.00 (starting point; APQC median per inbound contact: $11.00) | Total call center cost ÷ calls handled by the voice agent or an agent. |
The APQC figures are cross-industry medians from its Open Standards Benchmarking: speed of answer (468 organizations), abandonment (464), call handling time (275), first contact resolution by phone (458) and cost per inbound contact (927). APQC counts a call as resolved when it needs no further contact, and includes calls finished by automated systems, so its 80.0% isn't a like-for-like comparison with the agent-only figure here.
Why Call Center Dashboards Matter
The numbers in a call center are tied together, and that's what makes one screen useful.
ICMI's metrics guide treats abandonment as an outcome of service level, not a measure to manage alone. Occupancy works the same way: it rises when the queue is full and falls when there are enough agents. Chase one in isolation and another moves.
Automation changes what the old numbers mean. Handle time used to rise when something was wrong. With a voice agent taking the short calls, it rises because something is working.
ICMI makes the same point about cost: a climbing cost per contact can be good news, because fewer contacts spread the fixed costs more thinly.
Automation also adds a number with no agreed yardstick. We couldn't find a dependable published benchmark for containment. The figures in circulation come mostly from vendors, and they vary widely with the kind of call. Your own trend, read next to repeat calls, is the better guide.
The work is changing, too. The Bureau of Labor Statistics projects employment of customer service representatives to decline 5% between 2025 and 2035 as their tasks continue to be automated.
The calls that remain are the hard ones. A dashboard that still judges agents on speed will be measuring the wrong thing.
Building it in SimpleKPI
Build this dashboard yourself with SimpleKPI's KPI dashboards, or start from the Call Center focused KPIs template. The mechanics are the same whatever you track:
- KPIs: each one gets a target, an entry frequency and tags, so you can report by team, site, product or whatever you split the numbers by.
- Data: type numbers in, import a spreadsheet, or use an integration or the API. The dashboard updates as each number lands, so daily and monthly KPIs sit side by side.
- Reports: scheduled KPI reports email the numbers to people who never log in.
- AI: Kip, the built-in AI, suggests targets and flags indicative benchmarks (AI estimates, not peer data) once some history builds up.
- Price: $79 a month for unlimited users and KPIs, as one flat price, with a 14-day free trial and no card needed.