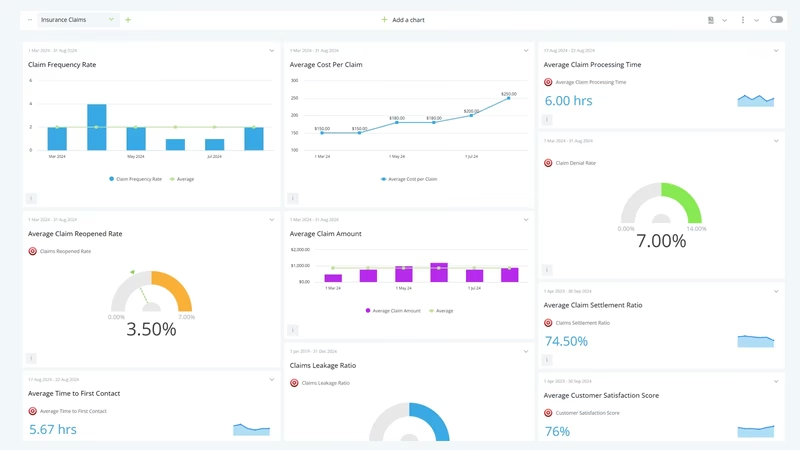
Insurance Claims Performance Dashboard
The hail comes through on a Tuesday afternoon. By Wednesday morning the first notice of loss line has a two-hour hold, roofing crews are knocking on doors in three counties, and every adjuster on the desk already had a full diary before any of it started.
Seasons like that aren't rare anymore. NOAA counted 27 billion-dollar weather and climate disasters in the US in 2024, and 17 of them were tornado outbreaks or hail and wind storms. NOAA then retired that database in May 2025. Climate Central, which took it over, counted 23 for 2025, a record 21 of them from severe weather.
For a property insurer, severe weather mostly means hail. The Insurance Information Institute put 2025 US insured losses from severe convective storms at $51 billion, the third straight year above $50 billion, and says hail accounts for as much as 80% of those claims in a given year. Roofs carry most of the cost, and roofs are where the disputes start.
The regulatory clock keeps running through all of it. The NAIC's model claims settlement regulation asks insurers to acknowledge a claim within 15 days, accept or deny within 21 days of proof of loss, and write to the claimant every 45 days while an investigation stays open. Each state writes its own version, but most claims managers will know the shape.
The insurer in this example is invented, and its monthly figures are modeled, though its spring 2025 looks a lot like the season those counts describe. Two targets below have a published figure next to them in the table. The other eight are starting points.
What is an Insurance Claims KPI Dashboard?
Overview
An insurance claims KPI dashboard shows how fast the claims team reaches a loss, whether it closes the file once without having to open it again, and what that handling costs in adjusting expense, lawsuits and goodwill.
It starts with the first call. Contact-to-inspection time is how long a policyholder with a damaged roof waits for someone to look at it. Pending claims inventory is the pile on the desk at month end, and claim closure rate says whether the pile grew or shrank that month.
Then the quality of the close. Claims cycle time is the average age of a file when it closes. Reopened claim rate catches the ones closed too early, which on a hail roof usually means a contractor's supplement. Claims litigation rate is the share of open files in suit.
Then the bill. Average claim severity is what the insurer paid out on each claim it settled with a payment. Cost per closed claim and the loss adjustment expense ratio show what it cost to adjust those losses. Claimant satisfaction score shows how it felt to the person whose kitchen ceiling came down.
Who benefits from this dashboard?
- VP of Claims: Pending inventory, closure rate and litigation rate answer the two questions the CEO asks every storm season: when will we be caught up, and what will it cost us?
- Property Claims Manager: Contact-to-inspection time and reopened claim rate show which teams reach losses late and which are closing roofs before the scope is agreed.
- Catastrophe Coordinator: Decides the day to call in independent adjusters. Inspection time crossing five days is a better trigger than a headcount guess made on day one.
- Claims Quality Manager: Reads average claim severity against reopens and suits. Severity that drops while those two climb isn't a saving. It's roofs paid short that come back as a supplement or a demand letter.
- CFO and Actuarial: The LAE ratio and cost per closed claim feed reserves and rate filings, and in a catastrophe month they point in opposite directions. Finance needs to know which one to believe.
Tag storm claims with the catastrophe code at first notice of loss, not at closing, and keep a non-catastrophe version of every KPI. Verisk's Property Claim Services assigns a catastrophe number when it expects an event to cause more than $25 million of US insured damage. Without the tag, one May hailstorm quietly sets your averages for the rest of the year.
Dashboard Example Overview
The example insurer writes homeowners, farmowners and personal auto policies across four Plains states, about 230,000 policies in all, with roughly 50 staff adjusters and an independent adjusting firm it can call on. Its claims board carries ten KPIs, updated monthly:
- Contact-to-Inspection Time: Average days from first notice of loss to the first inspection, in person or by video, for property claims inspected in the month. It's the wait a policyholder feels most.
- Pending Claims Inventory: Open claims at month end, new and reopened. The plainest measure of how far behind the desk is.
- Claim Closure Rate: Claims closed divided by claims opened in the month, reopened files counted as openings. Above 100% the pile shrinks, below it the pile grows.
- Claims Cycle Time: Average days from first notice of loss to closure, for claims closed in the month. It only sees the files that closed, which matters a great deal in a storm.
- Reopened Claim Rate: Claims reopened in the month divided by claims closed. On property, most reopens are supplements: more damage found once the roofer strips the shingles.
- Claims Litigation Rate: Open claims in suit divided by pending inventory. Suits arrive months after a storm and stay open for years, so this one trails everything else.
- Average Claim Severity: Total paid on claims closed in the month divided by the claims closed with a payment, in dollars. Roofs closed under the deductible drop out. Triple-I's figures from ISO put the average US homeowners claim at $20,062 in 2023, and $14,747 for wind and hail over 2019 to 2023. This board blends in auto, so its average sits lower.
- Cost per Closed Claim: Loss adjustment expense (staff adjusters, independent adjuster fees, and claim-specific legal and expert costs) divided by claims closed.
- Loss Adjustment Expense Ratio: Loss adjustment expense divided by incurred losses. The figure finance reports and regulators read.
- Claimant Satisfaction Score: Surveyed claimants rating their claim 4 or 5 out of 5, as a share of responses. Run by the customer experience team, much like the survey on a customer service dashboard.
The two years split into a calm winter, a very bad spring and a long tail.
Through the winter of 2024 into 2025 the desk is steady. In March 2025, inspections happen 3.0 days after first contact, 1,655 claims are open, the closure rate is 101% and the average file closes in 28 days. 86% of surveyed claimants rate the experience 4 or 5.
April 2025 brings the first hail. Inspection time more than doubles to 6.8 days, the closure rate falls to 56% and the inventory jumps to 2,980. May is worse. Storm after storm crosses the book, the average wait for an inspection reaches 11.6 days, and 6,420 claims are open at month end. The independent adjusting firm arrives in the third week, later than anyone wanted, because the call was made on headcount instead of on the wait.
May also produces numbers that look like good news and aren't. Cycle time falls to 22 days, because the claims closing are the quick ones: auto hail settled from photos and roofs with damage under the deductible. The litigation rate drops to 1.0%, only because thousands of new files dilute the same suits. And the LAE ratio falls to 3.9%, because incurred losses explode before the adjusting invoices arrive. Cost per closed claim, the more honest view of the same spending, has already climbed from $749 in March to $1,040.
The inventory peaks at 7,050 in June. From July the desk closes far more than it opens: 160% in July and 177% in August. The company triages hard. Auto hail moves to photo estimates, roofs get aerial imagery and one field visit, and a supplement desk takes roofing contractors' revised scopes so they stop landing in adjusters' diaries. By August, inspection time is back to 3.6 days.
Clearing the pile makes some numbers worse first. Cycle time peaks at 71 days in September 2025, because the files closing now are the old, hard ones. The reopened claim rate hits 9.1% in August as supplements pour in, and the LAE ratio jumps to 22.6% as independent adjuster invoices land against losses that have stopped growing. Claimant satisfaction bottoms at 65% in July. Average claim severity climbs from $9,640 in March to $14,980 in September. May's closures were auto hail and small roofs, so severity rose only a little that month, to $10,480. The full tear-offs, often with a supplement on top, close over the summer.
By March 2026 most of the board is back. Inspection takes 2.9 days, cycle time is 32 days, reopens are 3.6%, severity is $10,050 and satisfaction is 84%. Cost per closed claim, $1,210 at its July 2025 peak, is down to $800 by February and still falling.
April 2026 is the test: a smaller hail event, this time with an independent adjusting contract signed in advance. Inspection time peaks at 4.1 days instead of 11.6, the inventory rises to 2,240 and is falling again by May, and satisfaction holds at 83%. That contract carries a retainer, which is part of why cost per closed claim settles at $776 in September 2026, not the $742 of October 2024. The company decided that was a price worth paying.
One number never comes back. In September 2026 the inventory is 1,930, against a 1,700 target and 1,655 before the storms, even though the closure rate has been above 100% every month since May. The reason is in the litigation rate: 16.3% of open claims are in suit, about 315 files against roughly 65 before the hail. Most are 2025 roof disputes that went to attorneys months after the storm, and they'll close at the pace of courts and appraisal panels, not the desk. The ones that do settle pay more than the first estimate, which is why severity sits at $10,060 in September, just over its $10,000 target. Closing them faster would mean paying more than the claims are worth, so the board carries them, and next year's target will say so.
Creating an Insurance Claims Dashboard in SimpleKPI
-
Step 1 Fix when the claim clock starts and stops
Does cycle time start at the date of loss or at first notice of loss? Does it stop at final payment, or when the file closes after the last supplement? Is a reopened claim an opening for closure rate? Answer each once. Policyholders often report hail weeks late, when a roofer knocks, so a desk that counts from the date of loss can report a much longer cycle after a storm than one counting from first notice, for exactly the same work.
If you're still choosing which measures belong on the board, the guide to picking KPIs walks through it.
-
Step 2 Give every claims figure one owner
The claims system owns dates, counts and payments, and decides whether a claim closed under the deductible counts toward severity (it shouldn't). Litigation management owns suit status, usually from defense counsel's matter reports, the same matter data a law firm dashboard runs on. Finance owns loss adjustment expense, split into allocated costs like defense and experts and unallocated costs like staff. Independent adjuster invoices can arrive weeks after the work, so agree which month they count in. Set the direction as you go: eight of the ten improve as they fall, and only closure rate and satisfaction should rise.
-
Step 3 Split catastrophe claims out before the season
Build the storm view and the everyday view of the same ten KPIs while the desk is quiet. Agree the inspection-time trigger for calling in independent adjusters in February, not in the middle of May. And put the count of files due a 45-day status letter on the property manager's weekly view, because a backlog is when those letters get missed.
-
Step 4 Put every ratio next to its count
Read the LAE ratio beside cost per closed claim, cycle time beside pending inventory, closure rate and average claim severity beside reopened claim rate, and litigation rate beside the number of files in suit. Each ratio on its own told a flattering story at some point in this example's 24 months, and the count next to it was what gave it away.
List of Insurance Claims KPIs
Only cycle time and the LAE ratio have a published US figure to set beside them, and neither is a like-for-like benchmark. Triple-I's homeowners severity is context, not a target, because this board blends in auto. Everything marked (starting point) is this example's own target, to be replaced once you have a full year of your own claims history with catastrophe months split out.
| KPI Name | Typical Target | Description / Calculation |
|---|---|---|
| Contact-to-Inspection Time | ≤ 3 days (starting point) | Average days from first notice of loss to first inspection, for property claims inspected in the month. Lower is better. |
| Pending Claims Inventory | ≤ 1,700 open claims (starting point) | Open new and reopened claims at month end. Scale the target to your book. |
| Claim Closure Rate | ≥ 100% (starting point) | Claims closed divided by claims opened (new plus reopened) in the month. |
| Claims Cycle Time | ≤ 30 days, all lines (J.D. Power 2026: 40.7 days to final payment, homeowners) | Average days from first notice of loss to closure, for claims closed in the month. Set separate targets per line. |
| Reopened Claim Rate | ≤ 3% (starting point) | Claims reopened in the month divided by claims closed in the month. |
| Claims Litigation Rate | ≤ 5% (starting point) | Open claims in suit divided by pending claims inventory. Read with the count of suits. |
| Average Claim Severity | ≤ $10,000 (starting point) | Total paid on claims closed in the month divided by claims closed with a payment. Lower is better, read with reopen and litigation rates. |
| Cost per Closed Claim | ≤ $780 (starting point) | Loss adjustment expense divided by claims closed. |
| Loss Adjustment Expense Ratio | ≤ 13% (NAIC 2025 snapshot, all P&C lines: about 15.6%) | Loss adjustment expense divided by incurred losses. Distorted in catastrophe months. |
| Claimant Satisfaction Score | ≥ 85% (starting point) | Survey responses rating the claim 4 or 5 out of 5 divided by all responses. |
Why Insurance Claims Dashboards Matter
A claims department gets judged by people looking at different numbers. Finance reads the LAE ratio. The state insurance department reads complaints and missed deadlines. The policyholder only knows how many days the tarp has been on the roof. A department can satisfy any one of them while letting the others down, and in a catastrophe month it usually does.
Most of the ten pull against another one. Closing roof claims before the contractor's scope is in lowers cycle time and raises reopens. Pushing the closure rate with low first offers moves files into suit, where they stay open far longer than any reopen. Calling in independent adjusters early costs money per claim and saves days of inspection time. Paying a roof at the adjuster's first estimate holds average claim severity down this month. The roofer's supplement or the attorney's demand puts it back later, with defense costs on top.
None of those trade-offs is wrong in itself. Paying independent adjusters to cut an 11-day inspection wait is usually a good trade. Closing roofs before the scope is agreed rarely is. The point is to make those calls before the storm, with both sides of each one on the same screen.
In practice that means a short list of things done by February: the independent adjuster contract signed, the inspection-time trigger agreed, catastrophe codes ready at intake, and a supplement desk with a named lead. The hail arrives either way. The difference is whether the April board shows it coming or the September board explains what it cost.
Building it in SimpleKPI
Build this dashboard yourself with SimpleKPI's KPI dashboards. The mechanics are the same whatever you track:
- KPIs: each one gets a target, an entry frequency and tags, so you can report by team, site, product or whatever you split the numbers by.
- Data: type numbers in, import a spreadsheet, or use an integration or the API. The dashboard updates as each number lands, so daily and monthly KPIs sit side by side.
- Reports: scheduled KPI reports email the numbers to people who never log in.
- AI: Kip, the built-in AI, suggests targets and flags indicative benchmarks (AI estimates, not peer data) once some history builds up.
- Price: $79 a month for unlimited users and KPIs, as one flat price, with a 14-day free trial and no card needed.