Business dashboard software real-time insights from your data, made simple
Consolidate your data, metrics, and KPIs into clear graphs and charts that anyone in the business can read.
Track what matters, see changes as they happen, and share dashboards with the people who need them. All in one easy-to-use platform, at one flat price.

What is a business dashboard?
A business dashboard (also known as an executive or strategic dashboard) gives you a clear, real-time view of how your organization is performing. It consolidates your data, metrics, and Key Performance Indicators into one visual interface, so leaders and decision-makers can track progress toward their goals at a glance.
By turning raw data into something you can actually read, a good dashboard helps you spot trends, catch problems before they grow, and compare performance across departments, projects, or time periods through interactive charts, graphs, and tables.
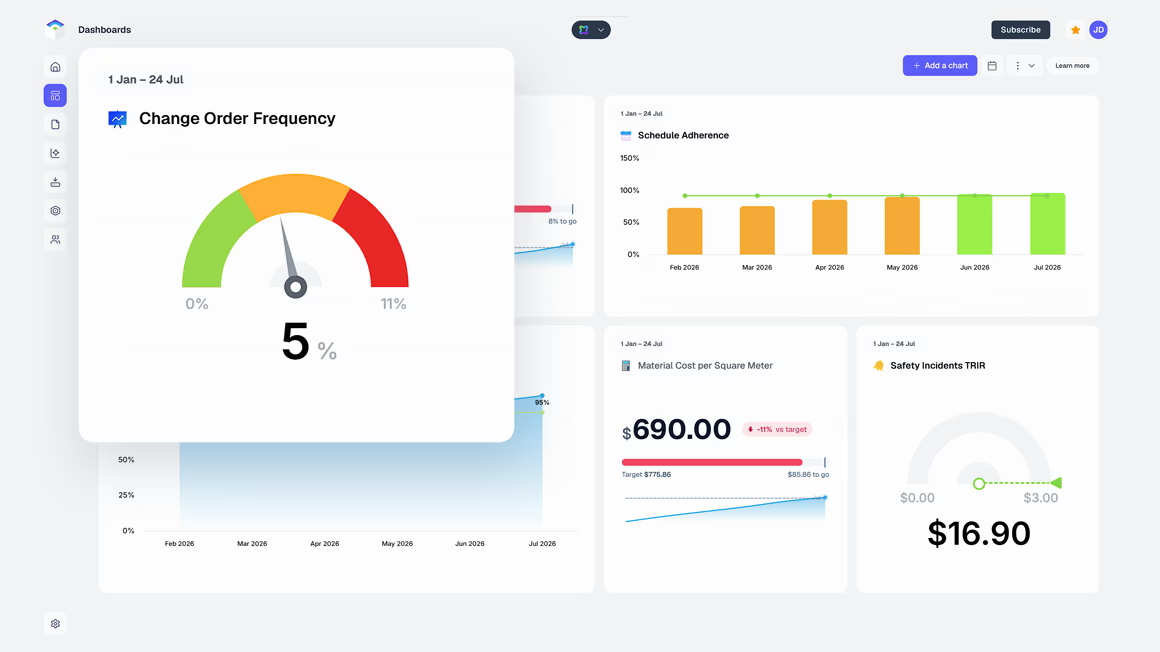
A smarter way to track business performance
Your data should work for you, not the other way around. But managing business performance can feel like juggling too many numbers, reports, and spreadsheets. One minute you're deep in sales data, the next you're scrambling to pull insights for your marketing team.
That's where business dashboard software steps in. No more scattered data. No more endless reporting. Just clear, real-time insights at your fingertips, so you can make smarter decisions, faster.

Built for business users, not just analysts
Most business tools flood you with raw data and expect you to make sense of it. SimpleKPI takes a different approach: your KPIs are visualized in real time, so you instantly see what's working, what's not, and where to focus next.
No technical skills required
Anyone can build a dashboard in minutes with the chart editor: pick a KPI, choose a chart type, and add it to the dashboard. No coding, no IT team required.
Customize it to fit your business
Choose from a library of pre-built templates or create your own from scratch. Adjust layouts and display the metrics that matter most to your business.
Connect all your data sources
Pull numbers from Excel, Google Sheets, or your cloud apps, and SimpleKPI brings it all into one unified view.
Turn your numbers into reports
When the numbers need to travel, create customizable KPI reports that deliver themselves by email as polished PDFs, on a schedule you set.
See business dashboards in action
A great business dashboard turns raw numbers into a story you can act on. Below are two real-world examples. Use them as inspiration, or as a starting point for building your own.
Customer service dashboard
Customer service teams live and die by response times and satisfaction. This dashboard brings retention, satisfaction levels, support volumes, and resolution times together in one view, so a team leader can see at a glance whether service is improving or slipping, and where the pressure is coming from.
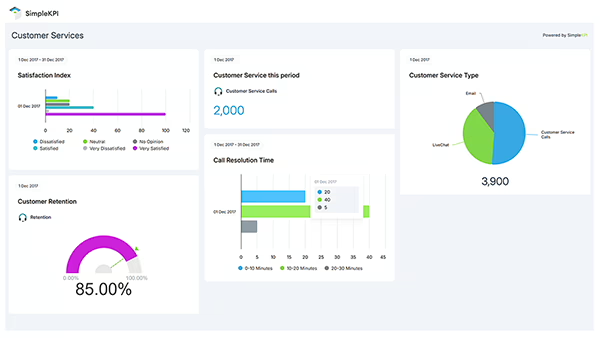
The KPIs and metrics used in this dashboard:
- Customer Retention
- Satisfaction Levels
- Support Calls
- Customer Service by Type
- Average Resolution Time
E-commerce dashboard
E-commerce platforms automatically track transactions, visitors, and nearly every step of the customer journey from lead to conversion. That data lends itself perfectly to a dashboard: new versus returning visitors, visits by social media source, even the percentage of shoppers who abandon their carts, all giving you a clear picture of how people buy on your site.
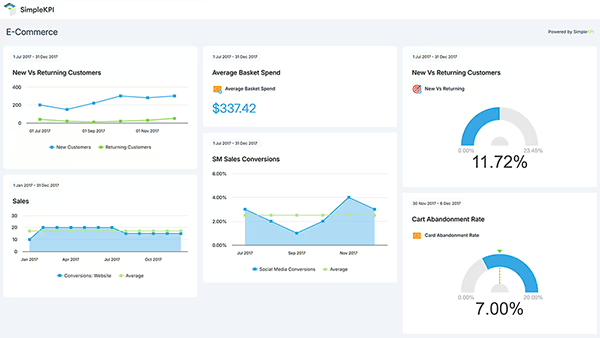
The KPIs and metrics used in this dashboard:
- Cart Abandonment Rate
- New Customers
- Returning Customers
- Average Basket Spend
- Social Media Conversions
- Sales

Do I need technical skills to create a dashboard?
No. SimpleKPI is built for everyone, not just data analysts. The chart editor lets you create dashboards in minutes: pick a KPI, choose a chart type, and add it to your dashboard. No coding or IT help required.
Can I integrate my existing tools and data sources with SimpleKPI?
Yes. Connect spreadsheets like Excel and Google Sheets, link your apps, or push data in through the developer API. All your key metrics land in one dashboard for a complete, real-time view of your business.
How does SimpleKPI differ from other dashboard software?
Simplicity and speed. Unlike complex BI tools, SimpleKPI is easy to set up, intuitive to use, and designed for real business users, not just data teams. You get the insight without the learning curve.
Is the dashboard customizable to my business needs?
Yes. Choose from pre-built templates or design your own from scratch. Adjust layouts, colors, and charts to match your workflow and show the metrics that matter most to your team.