What is an E-Commerce Dashboard?
An e-commerce dashboard is a visual display that brings an online store's key performance indicators, such as sales, average basket spend and cart abandonment, together on one screen. It turns the almost constant stream of data an online business generates into charts and gauges anyone can read at a glance. Store owners use it to watch daily trading. Marketing teams use it to check that campaigns are producing orders, not just traffic.
Overview
E-commerce covers the complete spectrum of buying and selling online, for one-person shops and large enterprises alike. It brings many technologies and disciplines together: card processing, shopping platforms, online marketing, inventory management, CRM systems and analytics tools. Every one of them generates data, and because that data is digital from the moment it exists, an online store is easier to measure than almost any other kind of business.
Easier to measure doesn't mean easier to understand. Transactions sit in the store platform, traffic in the analytics account, campaign results inside each ad and social channel. A dashboard stitches those pieces into one story: how many people arrived, what they bought, what they spent and whether they came back. It's also a practical starting point for an e-commerce strategy, because choosing which five numbers matter forces you to decide what the store is actually trying to do.
Who benefits from this dashboard?
- Store owners: sales, basket spend and the new versus returning mix in one view. For most stores that's enough to run the week.
- Marketing teams: social conversion figures show which channels produce buyers rather than followers, so budget follows revenue.
- Operations people: cart abandonment points at checkout friction, shipping surprises or slow pages before the revenue line shows the damage.
- Anyone just starting out: five clear numbers beat forty vague ones while you learn what normal looks like for your store.
Dashboard Example Overview
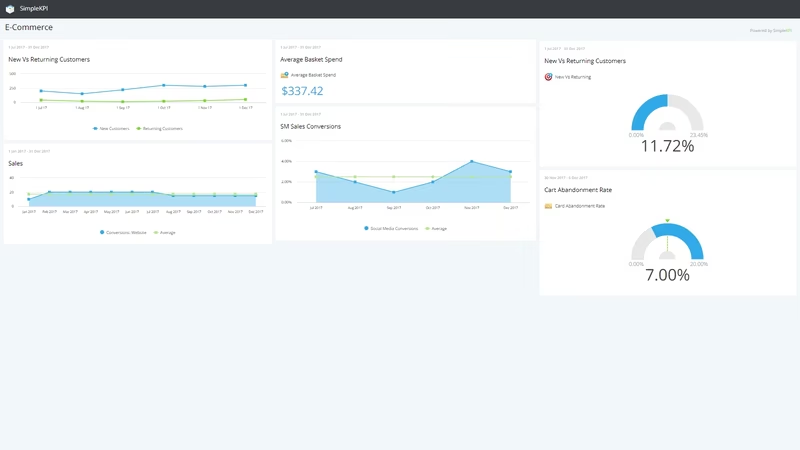
The dashboard pictured here is an e-commerce board built in SimpleKPI. It tracks five KPIs, grouped around three questions:
- How much are we selling? Sales gives the headline result, and Average Basket Spend shows whether growth comes from more orders or bigger ones.
- Where do buyers come from? New Vs Returning Customers splits the customer base between acquisition and loyalty. SM Sales Conversions tracks whether social activity turns into paid orders, which is the social number that belongs on a trading board. For the supporting metrics behind that figure, this guide to social media KPIs goes deeper.
- Where are we leaking money? Cart Abandonment Rate counts shoppers who filled a basket and left without paying. It's the most direct measure of checkout friction a store has.
Five KPIs is a small set, and that's the point. Each one answers a question a store owner actually asks, and each can be fed from systems the store already runs. Add more once these five have a few months of history behind them.
Read Cart Abandonment Rate next to Average Basket Spend. If abandonment climbs as baskets get bigger, shoppers are probably balking at shipping costs on the payment page, not at your products.
Creating an E-Commerce Dashboard in SimpleKPI
-
Step 1 Map your customer journey
Sketch the path from first visit to repeat purchase, then pick the measure that matters at each stage: arrival, basket, checkout, return visit. If you're unsure where to start, this guide to KPIs for e-business success walks through the thinking.
-
Step 2 Add your e-commerce KPIs
Create each KPI in SimpleKPI with a target and an update frequency. Tags keep things tidy by channel, product line or region. Plans include unlimited KPIs, so the list can grow with the store.
-
Step 3 Connect your data
Feed numbers in through spreadsheet imports, integrations or the API. Store platforms and analytics tools already export most of these figures; the job is landing them in one place on a schedule.
-
Step 4 Build views for different audiences
A daily trading view for the owner, a channel view for marketing, a monthly summary for anyone funding the business. Same data, different framing.
-
Step 5 Share, review, adjust
Put the dashboard on a screen, open the week with it, and let scheduled KPI reports carry the numbers to people who won't log in. Kip, the built-in AI, can suggest targets and flag indicative benchmarks (AI estimates, not peer data) as your history builds. Retire anything nobody acts on.
List of E-Commerce KPIs
The table below covers every KPI on the example dashboard. Targets are general guidance. Your own baseline beats any generic range.
| KPI Name | Typical Target | Description |
|---|---|---|
| Sales | On target or above | Total sales for the period, by value or order count. The headline figure the rest of the dashboard exists to explain. |
| Average Basket Spend | Trending up | The average value of a completed order. A cheap lever, too: raising it costs nothing in acquisition spend. |
| New Vs Returning Customers | Returning share stable or growing | Splits orders between first-time buyers and customers coming back. A shrinking returning share means the store is renting its customers, not keeping them. |
| SM Sales Conversions | Set from your baseline | Sales attributed to social media channels. Judges social on revenue rather than reach, which is the judgment that matters. |
| Cart Abandonment Rate | 60-80%, trending down | The percentage of shoppers who add items to a basket and leave without paying. High everywhere; the trend is what you manage. |
Why E-Commerce Dashboards Matter
An online store trades around the clock, and its numbers move while you sleep. Without a dashboard the morning starts with spreadsheet archaeology: an export from the store platform, another tab for analytics, a third for ad results. With one, the state of the business is a glance.
The deeper value is in the leading numbers. Sales is a lagging figure, and by the time it dips, the cause is days or weeks old. Cart abandonment and social conversions move first. A store that watches them can fix the checkout page or shift budget while the month is still in play.
The mix keeps you honest, too. Sales can look healthy while the returning-customer share quietly slides, which means future revenue is leaking even as current revenue holds. Five numbers on one screen make that kind of drift visible in time to act on it. That's the whole argument.
Build this dashboard yourself with SimpleKPI's KPI dashboards, and pay one flat price for unlimited users and KPIs.