What is a Sales Dashboard?
A sales dashboard is a visual display that brings a team's key sales KPIs, such as revenue, sales volume, quotes and opportunities, together on one screen. It shows performance against target in charts, gauges and league tables, so anyone can see where results stand without waiting for a report. Managers use it to run the team day to day. Executives use it to check that revenue is being generated efficiently across the business.
Overview
Sales runs on numbers, but the numbers tend to live in different places: activity in the CRM, quotes in a spreadsheet, revenue in the accounting system. A dashboard puts the whole pipeline in one view, from prospect meetings through quotes to closed revenue, and the connections become visible. When meetings drop, you can see the quote count that will sag a few weeks later.
Most sales dashboards fall into three broad types:
- Activity dashboards track the groundwork: calls, prospect meetings, quotes issued. Tie them to closed sales and you get conversion figures.
- Pipeline dashboards sort opportunities by stage and value, which makes them the natural forecasting tool.
- Leaderboards rank people or teams against target. Displayed openly, they do a lot of motivational work on their own.
The example on this page mixes all three, which suits a sales leader who wants one place to watch everything.
Who benefits from this dashboard?
- Sales managers: watch quotes, closing efficiency and revenue against target, and catch pipeline problems while there's still time in the month to fix them.
- Sales reps: a visible leaderboard means everyone knows where they stand without asking.
- Executives and owners: revenue, cost of sales force and the new versus repeat mix in one view. That's usually all a board meeting needs.
- Sales operations: conversion and quote-value figures show where the process leaks, so you fix the stage instead of blaming the rep.
Dashboard Example Overview
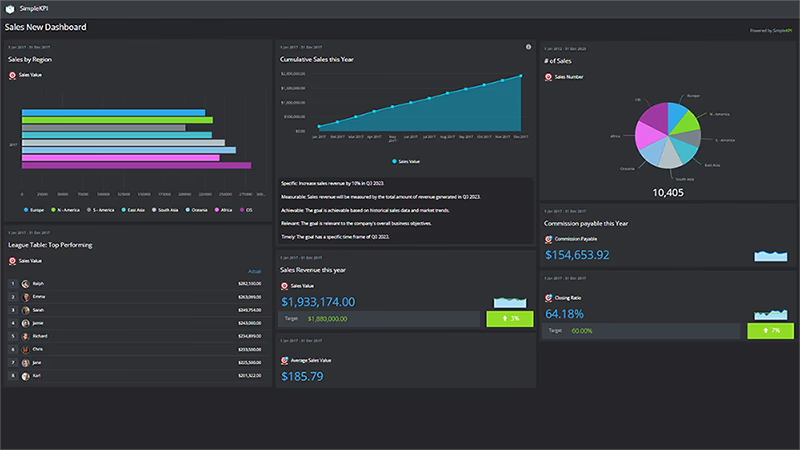
The dashboard pictured here is a dark-themed sales board built in SimpleKPI. It tracks fourteen KPIs, grouped around four questions:
- How much are we selling? Sales Revenue, Sales Volume and Average Sales Revenue give the headline results, while Repeat Sales Revenue and New Sales Percentage show where the money comes from.
- What's coming next? Opportunities, Prospect Meetings, Quotes and Value of Quotes cover the pipeline that feeds future months.
- How well do we convert? Closing efficiency connects quotes to closed sales, and Cost of Sales Force keeps the whole effort honest against what it costs to run.
- Are we growing each order? Attempted Up-sells, Successful 'Up sales' and Up-selling Success Rate measure whether the team expands deals or just takes the first yes.
Nothing here is exotic, and that's deliberate. These fourteen KPIs describe a complete sales operation, from first meeting to repeat revenue, and every one of them can be counted from records a sales team already keeps.
Put Quotes, Value of Quotes and Closing efficiency on the same view. When quote counts climb but closes stay flat, the problem is usually qualification, not effort.
Creating a Sales Dashboard in SimpleKPI
-
Step 1 Map your sales journey
Write down the stages a deal actually passes through, from first contact to closed sale, and pick the measure that matters at each one. If you're unsure what to track, this guide to essential sales KPIs is a sensible starting point.
-
Step 2 Add your sales KPIs
Create each KPI in SimpleKPI with its target and frequency. Tags keep things organized by team, region or product line. Plans include unlimited KPIs, so there's no pressure to trim the list to fit.
-
Step 3 Connect your data
Feed numbers in through spreadsheet imports, integrations or the API. Activity data tends to arrive daily and revenue monthly, and the dashboard updates as each lands.
-
Step 4 Build views for different audiences
A leaderboard for the sales floor, a pipeline view for managers, a revenue summary for the board. Same data, different framing. For a worked build, follow this step-by-step walkthrough of creating a sales KPI dashboard.
-
Step 5 Share, review, adjust
Put the dashboard on a screen, bring it to one-on-ones, and let scheduled KPI reports carry the numbers to people who won't log in. Kip, the built-in AI, can suggest targets and flag indicative benchmarks (AI estimates, not peer data) as your history builds. Retire any KPI nobody acts on.
List of Sales KPIs
The table below covers every KPI on the example dashboard. Targets are general guidance. Your own baseline beats any generic range.
| KPI Name | Typical Target | Description |
|---|---|---|
| Sales Revenue | On target or above | Total revenue from closed sales this period. The headline figure the rest of the board exists to explain. |
| Sales Volume | Set against quota | The number of sales by unit. Read next to revenue to see whether growth comes from more deals or bigger ones. |
| Average Sales Revenue | Trending up | The average revenue per sale. A falling average against steady volume usually points at discounting. |
| Repeat Sales Revenue | Stable or growing | Revenue from repeat customers. The cheapest revenue you have, and the first thing to protect. |
| New Sales Percentage | Set from your baseline | New versus repeat sales as a percentage. Shows whether the team is opening new accounts or living off the base. |
| Opportunities | Trending up | The number of opportunities, leads or contacts in play. Top of the funnel; everything below depends on it. |
| Prospect Meetings | Consistent week to week | The number of prospect meetings held. An activity measure that leads revenue by weeks, sometimes months. |
| Quotes | Enough to feed your close rate | The number of quotes issued by unit. Work backward from the revenue target and closing efficiency to set the level. |
| Value of Quotes | 3-4x revenue target | The total value of quotes issued this period. A serviceable proxy for pipeline coverage. |
| Closing efficiency | 20-30% | The share of quotes that become closed sales. A direct read on qualification and selling. |
| Cost of Sales Force | Set from your baseline | The full cost of the sales team. Track it beside revenue so growth stays profitable. |
| Attempted Up-sells | Rising with sales volume | The number of up-sell attempts by unit. A success rate means little if nobody attempts. |
| Successful 'Up sales' | Growing with attempts | The number of successful up-sells by unit. Added revenue with no acquisition cost attached. |
| Up-selling Success Rate | 10-30% | The percentage of up-sell attempts that succeed. A low rate on high attempts suggests the wrong offer, not the wrong effort. |
Why Sales Dashboards Matter
Visible numbers change behavior. When the leaderboard is on the wall, nobody needs chasing for updates, and the Friday scramble to work out where the month stands simply stops. That alone repays the setup time.
The deeper value is in the connections. Revenue is a lagging number, and by the time it disappoints, the cause is weeks old. A dashboard that shows prospect meetings, quotes and closing efficiency alongside revenue lets a manager act on the leading numbers while the month can still be saved.
Cost stays in the picture too. Pairing Sales Revenue with Cost of Sales Force keeps growth honest, because more revenue from a much more expensive team is a different story than the headline suggests. One screen, fourteen numbers, and the whole operation is legible at a glance. That's the point.
Build this dashboard yourself with SimpleKPI's KPI dashboards, start from the sales KPI template, and pay one flat price for unlimited users and KPIs.