KPI dashboards that keep everyone on track
Bring your KPIs to life with clear, beautiful, interactive dashboards everyone can understand.
Start with industry dashboard templates, create your own, or let AI lend a hand. Share them with your team, clients, or display them on a wall monitor so the numbers that matter are always in view.
One flat price. Unlimited users, dashboards, and KPIs. See pricing

Your dashboard, ready in minutes
Start with one of 50+ ready-made templates, create your own, or simply tell AI what you want. Connect an app or a spreadsheet and your data flows straight in. No code, no complicated setup, just a dashboard that works for you.

See what matters
Turn your KPIs into clear, interactive charts that make performance, trends, and progress easy to understand, with forecasting that shows where you're heading.

Keep everyone aligned
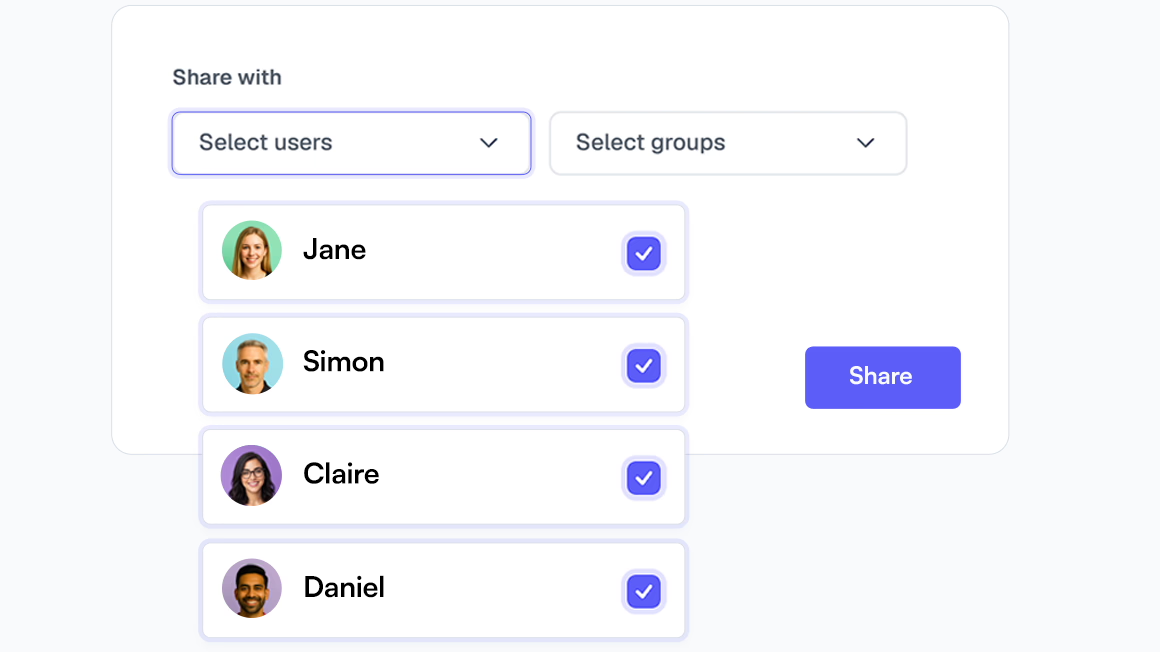
Share dashboards with your team or clients, so everyone sees the same numbers and knows what needs attention.
Put your KPIs on display
Show live dashboards on office wall monitors and keep the numbers that matter visible throughout the day.

Customize your charts, theme, and brand
Make every dashboard look the way you want it. Pick the colors for each chart series to match your brand, switch between light and dark themes, and toggle targets, averages, cumulative views, and forecasts on any chart.

More dashboard features included
Every dashboard includes a full set of tools to help you explore, present, and share your KPI data.

20+ chart and widget types
Line and bar graphs, gauges, bullets, pies, league tables, top and bottom lists, and free-text blocks.

Multi-KPI charts
Plot up to six KPIs on one chart, each with its own compare window, like last period or same period last year.

Drag-and-drop layout
Arrange charts on a free-form grid. Drag to reposition, drag a corner to resize, and the layout saves as you go.

RAG targets
Set red, amber, and green thresholds so any chart shows its health at a glance.

Breakdowns and filters
View a chart by people, offices, or any breakdown you define, or filter it to just the members you care about.

Dashboard date override
Change every chart's date range at once from the dashboard toolbar, with built-in compare periods.

Chart commentary
Add notes to any chart, or let Kip write a narrative explanation of what the chart is showing.

Chart embeds
Generate an embed code for any single chart and drop it into your website, intranet, or client portal.

PDF export
Export any dashboard to a polished PDF, portrait or landscape, with a matching print view.
Dashboard features at a glance
Everything below is included for every account, with no tiers, add-ons, or usage meters.
| Feature | What it does | Included |
|---|---|---|
| Unlimited dashboards | Create as many dashboards as you need. No caps, no per-dashboard charges. | Included in the one price |
| Chart types | More than 20 chart and widget types, from graphs and gauges to league tables and lists. | Included in the one price |
| Industry templates | 50+ ready-made dashboards that create their KPIs and charts in one click. | Included in the one price |
| Build with AI | Describe what you need and Kip builds it, always confirming before anything changes. | Included in the one price |
| Drag-and-drop layout | Free-form grid: drag to reposition, resize to fit, saved automatically. | Included in the one price |
| Multi-KPI charts | Up to six KPIs on one chart, each with its own compare period. | Included in the one price |
| Date ranges and compare | Presets or custom ranges per chart, plus a dashboard-level override. | Included in the one price |
| Breakdowns and filters | View any KPI by team, office, or person, or filter to specific members. | Included in the one price |
| RAG targets | Red, amber, and green thresholds that show health at a glance. | Included in the one price |
| Colors and display options | Per-series colors plus toggles for targets, averages, cumulative, and forecast. | Included in the one price |
| Chart commentary | Notes on any chart, with an AI-written narrative on request. | Included in the one price |
| Team sharing | Share with chosen users, with an option to restrict data to their own. | Included in the one price |
| Public dashboards | No-login share links you can revoke or regenerate anytime. | Included in the one price |
| Chart embeds | Embed individual charts in websites and portals. | Included in the one price |
| Wall display mode | Full screen with auto-rotation, made for office monitors. | Included in the one price |
| PDF export | Landscape or portrait PDF plus a matching print view. | Included in the one price |
| Copy and duplicate | Duplicate dashboards, push copies to colleagues, and copy single charts across. | Included in the one price |
| Favorites | Star any dashboard to pin it to your Home screen favorites. | Included in the one price |
| Explore deep dive | Jump from any single-KPI chart straight into a full Insights deep dive. | Included in the one price |

Is there a limit on how many dashboards I can create?
No. Dashboards are unlimited, along with users, KPIs, and reports. Create as many as you need, it's all in the one flat price.
Do I need any technical skill to build a dashboard?
No. Click Add a chart, then pick the chart type and KPI in the panel that slides out and save it to the dashboard, or describe what you want and let the built-in AI build it for you. No code required either way.
Can I put a dashboard on a wall-mounted TV?
Yes. Full-screen wall display mode shows your dashboards edge to edge, with auto-rotating views and a refresh interval you can set anywhere from 15 seconds to 10 minutes.
Can I share a dashboard with people outside my account?
Yes. Generate a public share link that needs no login to view, and revoke it at any time. You can also embed individual charts in your own website or intranet with an iframe.
Are industry dashboard templates included?
Yes. There are more than 50 ready-made dashboard templates covering common industries and functions, so you can start from something close to finished rather than a blank grid.