KPI Insights the analytics behind every KPI
Pulse shows you what's moving right now. Explore takes you deep on a single KPI, with a trend, a verdict, root causes, a forecast, and practical fixes you can act on.


Pulse
The live feed
Pulse gives you a clear, up-to-date view of what's changing across your KPIs.
Every KPI, one live feed
Missed targets, standout results, unusual values, and important changes appear as they happen. Each event shows the value against its target, plus a mini trend for instant context. Filter by KPI, date, or event type to focus on what matters.
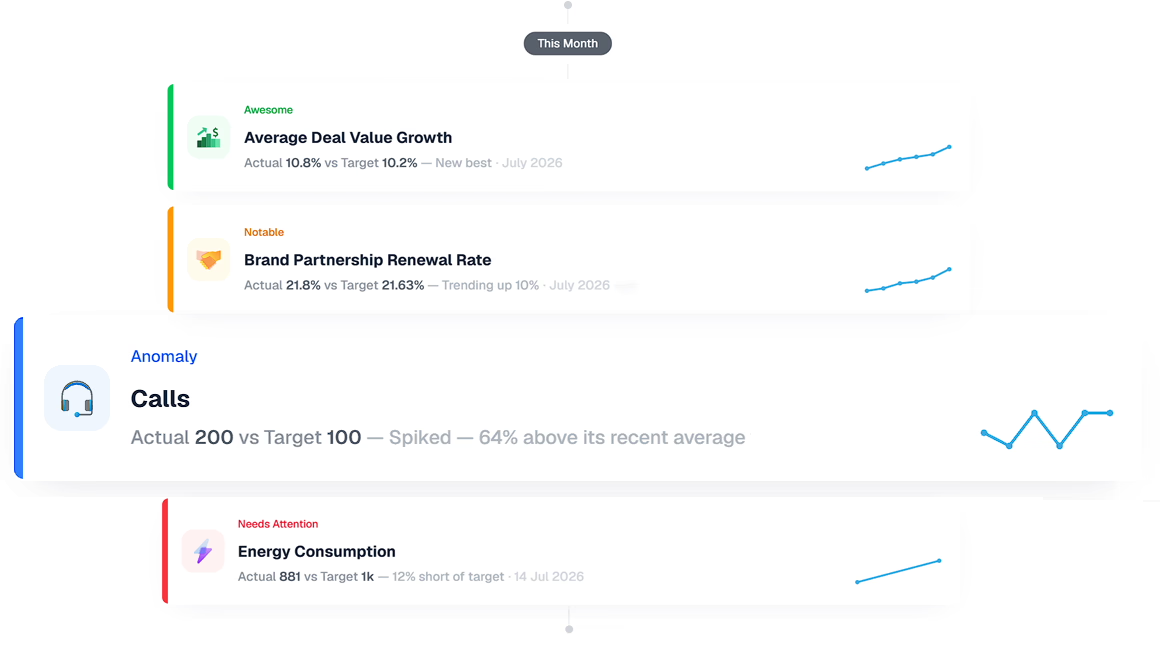
Choose what's important
Adjust what Pulse treats as critical, notable, or worth celebrating. You can also adjust anomaly sensitivity, so it spots unusual patterns without filling your feed with noise.

Explore
The deep dive
Explore takes you inside a single KPI to understand what's really going on, and what to do about it.
Trends, anomalies, and root causes
See the full history of a KPI, with unusual spikes and dips flagged directly on the chart. A clear verdict and likely causes help explain what's happening.

KPI forecasting
See where your KPI is heading with a forecast plotted alongside its history and target. Spot potential problems early and see whether you're on course.

Practical recommendations
When a KPI needs attention, Explore suggests clear next steps, from quick fixes to longer-term improvements.

Industry benchmarking
Compare your performance with typical results for your industry. AI-estimated benchmarks provide a quick sense check rather than a comparison using real peer data.

The same analytics for everyone, without the enterprise price
From individuals to large enterprises, everyone gets the same analytics capabilities: anomaly tracking, root causes, forecasts, and practical recommendations. No premium tier, no analytics add-on, just the one flat price.
More Insights features included
Pulse and Explore include a full set of tools to help you monitor, understand, and improve your KPIs.

Four clear verdicts
Every KPI gets a plain-English verdict: on track, notable, awesome, or needs attention.

Anomaly tracking
Catches numbers that break a KPI's usual pattern, even when targets are technically being hit.

Root causes
When a KPI moves, Explore shows you what's likely behind the change.

Forecasts
See where a KPI is heading based on its trend, plotted against the target.

Indicative benchmarking
An AI-estimated view of where you sit against typical results in your sector.

How to fix recommendations
Practical suggestions you can act on right away or plan for the longer term.

Tunable thresholds
Decide how far a KPI must miss or beat target to count as critical, notable, or worth celebrating.

Home screen widget
The latest Pulse events greet you the moment you log in, one click from the full feed.

Explore from anywhere
Jump into a deep dive straight from any single-KPI dashboard chart.
Insights features at a glance
Everything below is included for every account, with no tiers, add-ons, or usage meters.
| Feature | What it does | Included |
|---|---|---|
| Pulse live feed | Every KPI event in one filterable feed, grouped from today back through the year. | Included in the one price |
| Event types | Critical, notable, awesome, and anomaly events, classified automatically. | Included in the one price |
| Tunable thresholds | You decide what counts as critical, notable, or worth celebrating. | Included in the one price |
| Anomaly tracking | Flags numbers that break the usual pattern, even inside target. | Included in the one price |
| Feed filters | Filter the feed by KPI, date range, or event type. | Included in the one price |
| Home screen widget | The latest Pulse events on login, with a view-all link. | Included in the one price |
| Trend verdicts | On track, notable, awesome, or needs attention, on every KPI. | Included in the one price |
| Root causes | The likely drivers behind a change, shown alongside the chart. | Included in the one price |
| Forecasts | Where a KPI is heading based on its trend. | Included in the one price |
| Indicative benchmarking | AI-estimated sector comparison via your benchmark profile. Indicative, not real peer data. | Included in the one price |
| How to fix | Practical recommendations when a KPI needs attention. | Included in the one price |
| Explore from dashboards | Open a deep dive from any single-KPI chart. | Included in the one price |
| Favorites | Star any Explore view to pin it to your Home screen favorites. | Included in the one price |

What is Insights in SimpleKPI?
Insights is the analytics home in SimpleKPI. It's made up of two parts: Pulse, the live feed showing what's moving across your KPIs right now, and Explore, a deep dive into a single KPI when you need to understand what's behind a number.
What is Pulse?
Pulse is the live feed inside Insights that watches every KPI you track and surfaces the events that matter: a target missed, a target beaten, or a number that doesn't look right. Each event shows the actual value against target with a mini trend, and events are grouped by time from today back through the year.
How does Pulse decide what's worth showing me?
Every event is classified as critical, notable, awesome, or an anomaly. You set the thresholds yourself in Insight settings, choosing how far a KPI has to miss or beat target, how much movement counts as notable, and how sensitive anomaly detection should be, so the feed matches what actually matters to your business.
What is anomaly tracking?
Anomaly tracking is Pulse looking for numbers that break a KPI's usual pattern, even when the KPI is technically hitting target. It's built to catch the kind of change a simple target check would miss.
What does Explore actually show me?
For any KPI, Explore shows a trend chart with a clear verdict, on track, notable, awesome, or needs attention, along with flagged anomalies, likely root causes, a forecast of where the KPI is heading, and How to fix recommendations when a KPI needs a closer look.
How does the industry benchmark work?
Once you complete your benchmark profile in Settings, Explore turns on an indicative industry benchmark for the KPI, giving you a general sense of how it compares to typical performance in your sector. It's an indicative comparison, not real peer data.
Where do I find Pulse?
There's a Pulse widget on the Home screen with a View all activity link, and the full feed lives inside Insights alongside Explore, where you can filter by KPI, date range, or event type.