Getting started with your SimpleKPI account in just a few simple steps
Follow this guide to start tracking your KPIs on dashboards and reports in minutes. Sign up in seconds, no credit card required.
Up and running in minutes
Three simple steps take you from sign-up to your first live dashboard.
Add your KPIs
Create KPIs from scratch, import via spreadsheets, or choose from predefined templates and libraries.
Add your data

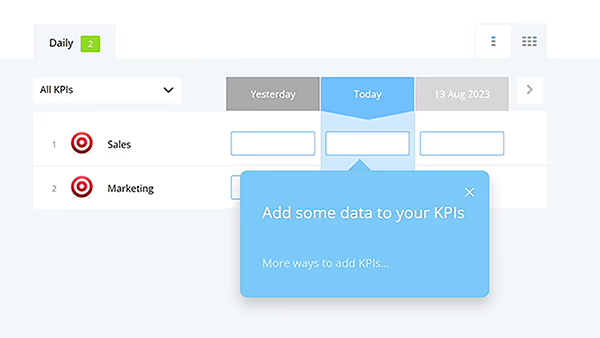
Add your data via spreadsheets, connect automatically to your existing data sources, or enter it manually.
Create your dashboards
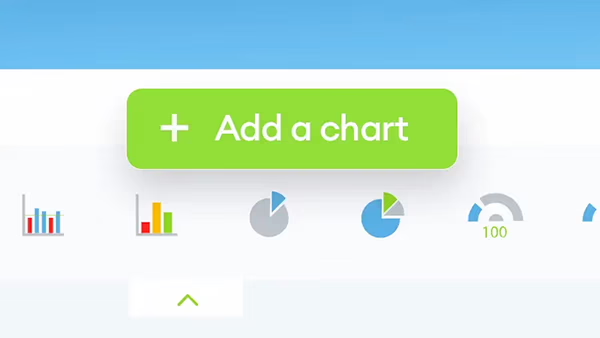
Choose from predefined dashboards, or build your own by adding charts from the panel that slides out.
Your SimpleKPI getting started guide
Welcome to SimpleKPI, the KPI tracking software built to help you measure performance across sales, marketing, customer service, or any other part of your business. Create, visualize, and share your key performance indicators with ease.
This guide walks through the basics of SimpleKPI so you can get started in minutes. Let's begin.
How to get started with SimpleKPI
Follow each step below to go from sign-up to your first live dashboard.
Create your account
Signing up takes less than a minute, and no credit card is required.
- Enter your email address and click "Continue", or click "Google" to sign up with your Google account instead.
- If you signed up by email, enter the 6-digit passcode sent to your inbox to verify your account (Google sign-ups skip this step).
- Tell SimpleKPI your name so it can personalize your dashboards and reports (Google sign-ups skip this too, since Google already provides it).
- You'll land on the setup screen, ready to choose how you want to get set up.
Choose how you want to get set up
The setup screen offers five ways to start tracking your KPIs. Pick whichever suits your business, or ask the built-in AI to point you in the right direction.
Choose a KPI Template
Start with a ready-made dashboard for your industry, complete with KPIs and charts already built.
- Click the "Choose a KPI Template" card on the setup screen.
- Search or browse the gallery of built-in templates, each showing its KPI and chart counts, and pick the one that fits your business.
- SimpleKPI builds your dashboard and confirms it's ready, along with how many KPIs and charts it created.
- Choose to enter your data manually on the KPI Sheet, or connect a data source to pull it in automatically.
Import a spreadsheet
Drop in an existing XLSX or CSV file and let SimpleKPI set up your KPIs and data from it.
- Click "Import your spreadsheet" on the setup screen, then choose a .xlsx, .xls or .csv file.
- SimpleKPI reads the file locally to your account and works out how its columns map to KPIs.
- Review what it found on the "Almost there" screen: check or edit each detected KPI's name, category, format, frequency and direction, and look over any flagged issues.
- Click "Import" to confirm, then view your new KPIs or an example dashboard built from your richest data.
Ask Me, AI at the core
Describe your business in plain English and let the AI suggest or build your KPIs and dashboards.
- Type into the message box on the setup screen, or click "Ask me" in the header at any time.
- Tell it about your business or what you'd like to track.
- When it wants to create or change something, such as a KPI, dashboard or chart, it shows you a preview first.
- Click "Confirm" to let it go ahead, or "Cancel" to hold off.
Connect a data source
Pull your data in automatically from apps like Xero, Stripe and Google Analytics.
- Click "Connect your data" on the setup screen to see the list of available apps.
- Search for the app you use, or click "Request a connection" if you can't find it.
- Click the app's card and complete its setup: enter credentials or sign in with the provider, then choose which accounts or items to sync.
- Once connected, SimpleKPI confirms how many KPIs it created and imports your data in the background.
Set up manually
Prefer full control? Click the quieter "Setup Manually" option below the three cards, then follow the three-step guide: add your KPIs, add some data, then create a dashboard.
To add your first KPI, follow these steps:
- Enter a name for your KPI, such as "Sales Revenue" or "Customer Satisfaction".
- Choose a frequency for your KPI, such as daily, weekly, monthly, or annually.
- Enter a target value for your KPI, such as $10,000 or 90%.
- Click "Save".

To add data to your KPI, follow these steps:
You can add data manually, by uploading a spreadsheet, or by linking a data source.
- Select the method that suits you best from the options on screen.
- Choose a frequency for your data, such as daily, weekly, monthly, or annually.
- Follow the instructions to connect or upload your data source.
- Click "Next".
Build your first KPI dashboard
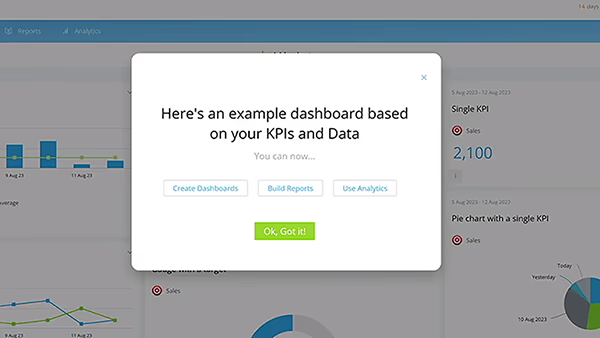
Depending on how you got set up, you may already have a starter dashboard, a visual representation of your KPIs that lets you monitor and analyze performance at a glance. Either way, you can keep adding and arranging your own charts.
To customize or build your dashboard, follow these steps:
- Click the add a chart icon at the top of the dashboard.
- Click the chart type you wish to add. Hovering over each type shows more information about it.
- Adjust the settings, such as KPI, date range, and colors.
- Click "Save".
- Once the chart is added, position it by clicking and dragging its top bar.
Create and share reports
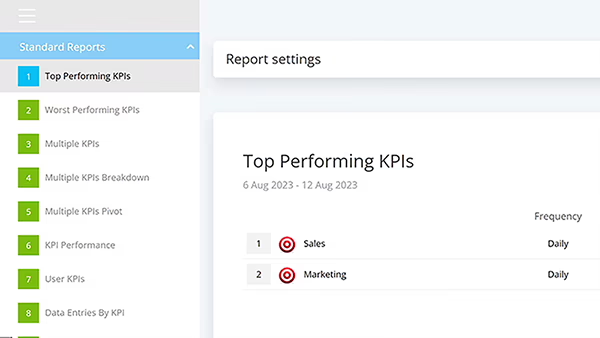
Reports let you dig deeper into your KPI data, filtering and grouping information to analyze performance across your organization and share findings with your team.
To create a report, follow these steps:
- Click the "Reports" tab on the top menu bar.
- Open the Reports settings menu to access the report settings.
- Adjust the settings, such as KPI, date range, filters, and colors.
- Once the report is created, save it using the "save" icon in the top right menu bar.
To share a report, follow these steps:
- Click on a saved report.
- Click the share icon in the top right of the menu.
- Choose to share via a public link, or within the application to specific users and groups.
- Click "Share".
Customize and manage your account
SimpleKPI gives you full control over how you use and manage your account. Customize the look and feel by going to the "Manage My - Settings" options, where you can change colors, logos, language, financial date settings, and your account's domain name.
Priority email support is included for every customer. You can also manage your subscription from the "Manage My - Billing" options, where you can view your plan, billing history, and payment methods.
More on adjusting your account settings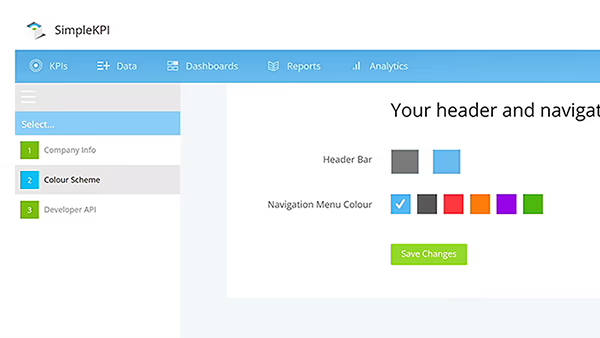
Finding your way around your Home screen
Once you're set up, the Home screen becomes your daily starting point. It gives you a quick read on how everything is performing before you dive into your dashboards and reports.
- KPI Score: a 0 to 100 gauge that rolls all of your KPIs into a single health score, broken into five bands: over target, on track, at risk, under target, and no data.
- Pulse: the latest significant events across your KPIs, with a View all activity link through to the full feed in Insights.
- To Do: a checklist of any remaining setup steps, such as adding KPIs, connecting a data source, and inviting your team. It ticks itself off as you go.
Using Insights: exploring your KPIs and Pulse
Insights is where SimpleKPI helps you understand the why behind your numbers. You'll find it in the main menu, and it comes in two parts: Pulse and Explore.
Pulse: your live KPI feed
Pulse watches every KPI and surfaces the moments that matter as a live feed of cards, each showing the actual value against its target with a mini trend.
- Events are grouped by time, from today back through the year, and classified as critical, notable, awesome, or an anomaly.
- Use the filters to focus on specific KPIs, date ranges, or event types.
- Open Insight settings to tune what counts as an insight, such as how far a KPI must miss or beat its target, and how sensitive anomaly detection should be.
Explore: a deep dive into any KPI
Explore takes a single KPI and breaks down what's driving it, so you know exactly where to act.
- A trend chart with a clear verdict on where the KPI stands, such as on track or needs attention.
- Sections covering anomalies, root causes, and a forecast of where the KPI is heading.
- An industry benchmark that unlocks once you complete your benchmark profile in Settings.
- A How to fix panel with practical recommendations you can act on now or plan for the longer term.

Frequently asked getting started questions
If you have more getting started questions, visit our FAQ page or our support portal for more information.
How do I start a free trial?
Sign up at my.simplekpi.com/trial. The trial is free for 14 days and includes every feature, with no credit card required. When you're ready, you can subscribe at any time by clicking the subscribe button.
Can I upload a data spreadsheet?
Yes, you can upload an Excel spreadsheet for your data and KPIs. You can also link a Google Sheet so your data updates on SimpleKPI automatically.
Can I pull my data from other software?
Yes. From the setup screen or your account settings, you can connect apps such as Xero, Stripe, Zendesk, Google Analytics and Google Search Console to pull your data in automatically, with more integrations on the way.
What are public sharing KPI dashboards?
When sharing a dashboard, you can generate a link that lets anyone view it without having to log in to your account.