What is a Marketing Dashboard?
A marketing dashboard is a reporting tool that puts your marketing KPIs on one screen: spend, budget, leads, website traffic, social reach, and return on investment. It pulls those numbers out of ad platforms, analytics tools, and spreadsheets so you can see what your marketing is doing without opening six tabs to find out.
Overview
Marketing throws off more data than almost any other part of a business. The ad platforms report clicks. The email tool reports opens. The website reports visitors, the social accounts report followers, and finance holds the budget in a spreadsheet nobody else can find. Each number is accurate, and none of them, on its own, tells you whether the marketing is working.
A dashboard does the unglamorous job of putting those numbers side by side, against targets, over time. The last part earns its keep. One month of data says very little. Six months of the same KPIs, measured the same way, shows you which channels are getting cheaper, which are getting tired, and whether budget is flowing to the places leads actually come from.
It also settles arguments. When everyone reads from the same numbers, meetings spend less time on whose spreadsheet is right and more time on what to do next.
Who benefits from this dashboard?
- Marketing managers: spend against budget and leads against goal, live, which covers most of what the month-end report was going to say anyway.
- Channel specialists: paid, email, social, and organic each get their own numbers next to the totals, so every specialist knows what their channel contributes.
- Founders and directors: one honest answer to what the marketing budget is producing. That answer is the ROI figure on this dashboard.
- Agencies: a client-facing view of spend, leads, and reach that replaces the monthly deck that takes an afternoon to build.
Dashboard Example Overview
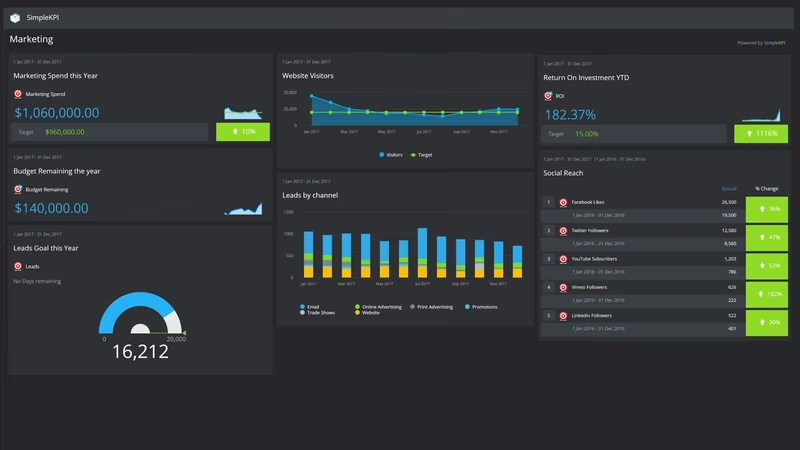
The dashboard pictured above tracks seven KPIs a marketing team would review weekly:
- Marketing Spend totals marketing costs for the period, including salaries, PPC, advertising, and PR.
- Budget Remaining shows spend against budget for the year to date, so the team always knows the runway left.
- Leads Goal counts inbound leads across all channels against the target set for the period.
- Website Visitors tracks unique visitors, the widest point of the funnel.
- ROI is the return on marketing spend. It is the number the rest of the business judges marketing by, so it belongs where everyone can see it.
- Leads by channel splits the lead total by source, which is where you learn where the next unit of budget should go.
- Social Reach follows audience growth across the social accounts the team runs.
Notice the pairing. Spend sits beside budget remaining. Leads sit beside their goal, and the channel breakdown sits under the total. Every number arrives with its context, which is the difference between a dashboard and a pile of charts.
Give each source in the Leads by channel chart its own target instead of one blended goal. A blended number lets a fading channel hide behind a strong one for months.
Creating a Marketing Dashboard in SimpleKPI
-
Step 1 Map your marketing funnel
Write down the stages a customer moves through, from first visit to closed deal, and pick the number that matters at each one. Visitors at the top, leads in the middle, ROI at the end. If a metric would not change a decision, leave it off the dashboard.
-
Step 2 Add your marketing KPIs
Create each KPI in SimpleKPI with its unit, target, and update frequency, and tag KPIs by channel so reporting stays organized. Not sure what a sensible target looks like? Kip, the AI built into SimpleKPI, can suggest indicative benchmarks. They are AI estimates rather than real peer data, but they give you a defensible starting point until your own baseline takes over. There is more on how that works on the AI at the core page.
-
Step 3 Connect your data
Feed the dashboard with spreadsheet imports, integrations, or the API. Manual entry works fine for KPIs you update weekly. The goal is a dashboard that stays current without anyone having to remember it.
-
Step 4 Build views for different audiences
The team wants channel detail. The board wants spend, leads, and ROI on one screen. Build a view for each rather than cramming everything onto one dashboard, and keep every view honest by driving them all from the same KPIs.
-
Step 5 Share, learn, and improve
Put the dashboard on a screen, share it with the team, and schedule KPI reports so the monthly numbers land in inboxes without anyone assembling them. If reporting is the part of the job you like least, this walkthrough on creating marketing reports in SimpleKPI covers it end to end. Then revisit the KPIs each quarter; a dashboard that never changes is usually a dashboard nobody is using.
List of Marketing KPIs
These are the KPIs on the example dashboard, with targets to treat as guidance rather than gospel. Your own baseline beats any generic range.
| KPI Name | Typical Target | Description |
|---|---|---|
| Marketing Spend | At or under plan | Total marketing costs for the period, including salaries, PPC, advertising, and PR. |
| Budget Remaining | In step with time left in the period | Expenses versus budget year to date. Flags overspend while there is still time to correct it. |
| Leads Goal | 100% of the period's goal | Total inbound leads generated across all channels, measured against the target you set. |
| Website Visitors | Trending up | Unique website visitors this period. Top-of-funnel volume that feeds everything below it. |
| ROI | 3:1 to 5:1 | Revenue attributed to marketing divided by what was spent to produce it. |
| Leads by channel | Set from your baseline | Lead volume split by source, such as organic, paid, email, and referral, so each channel's contribution is visible. |
| Social Reach | Growing quarter over quarter | New followers across the accounts you run, such as Facebook, LinkedIn, and Instagram. |
Why Marketing Dashboards Matter
Marketing budgets get questioned more than most budgets, and usually with the least data in the room. A dashboard changes the shape of that conversation. Instead of defending the spend from memory, you point at spend, leads, and ROI on one screen and talk about what to do next.
The quieter benefit shows up inside the team. When cost and results sit next to each other in plain view, people adjust earlier. A channel that is drifting gets attention in week two instead of at the quarterly review, and a channel that is quietly outperforming gets more budget before the opportunity cools.
None of this needs a data team or a warehouse project. Seven well-chosen KPIs, updated on a schedule and reviewed in the same meeting each week, will beat a sophisticated setup nobody looks at.
Build this dashboard yourself with SimpleKPI's KPI dashboards, start from the marketing KPI template, and pay one flat price for unlimited users and KPIs.