What is an Advertising Dashboard?
An advertising dashboard is a visual display that brings your key advertising KPIs, such as cost per click, click-through rate, conversions and return on ad spend, together on one screen. It shows how campaigns are performing right now, in charts and gauges rather than a platform export nobody opens. Marketers use it to decide where the next dollar goes. Owners use it to check the ads are paying for themselves.
Overview
The awkward thing about advertising data is that every platform keeps its own scoreboard. Google reports in one place, Meta in another, LinkedIn in a third, and each is happy to tell you how well it's doing by its own preferred measures. A dashboard pulls those numbers into one view, on your terms, so a dollar spent on search can be compared with a dollar spent on social without six open tabs.
Most advertising dashboards answer three kinds of question:
- Spend dashboards watch the money: Total Spend, CPC and CPA, so budgets stay under control across platforms.
- Performance dashboards track impressions, click-through rate and quality score, the mechanics of whether ads earn attention.
- Return dashboards connect it all to business results: conversions, leads and ROAS.
The example on this page mixes all three, which suits anyone responsible for a whole advertising budget rather than a single channel.
Who benefits from this dashboard?
- Paid media specialists: CPC, CTR and quality score in one view, so underperforming ads get caught and rewritten before the budget disappears into them.
- Marketing managers: spend against return across every channel, which is the view you need when someone asks why the budget should not be cut.
- Business owners: ROAS and CPA answer the only two questions that matter at that level. Is the advertising profitable, and what does a customer cost?
- Agencies: one dashboard per client, updated automatically, beats assembling a monthly slide deck from four platform exports.
Dashboard Example Overview
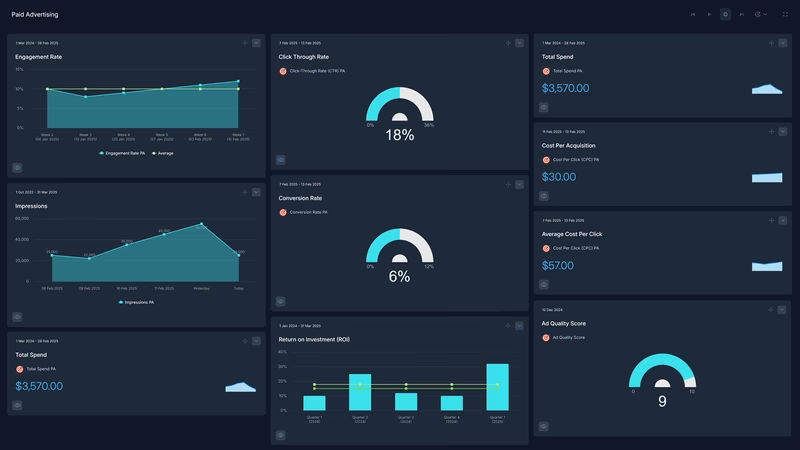
The dashboard pictured here tracks twelve KPIs across paid channels, grouped around four questions:
- What are we spending, and what does it return? Total Spend, Cost Per Click, Cost Per Acquisition and Return on Ad Spend follow the money from budget to result.
- Are the ads being seen and clicked? Impressions, Click-Through Rate and Average Position cover visibility and attention.
- Do the platforms rate the ads well? Ad Quality Score and Engagement Rate matter because platforms reward relevant ads with cheaper clicks and better placement. If social carries much of your budget, this guide to social media KPIs goes deeper on the engagement side.
- What happens after the click? Traffic from Ads, Conversion Rate and Lead Generation Rate show whether clicks turn into customers or just visits.
Nothing here needs a data warehouse. Every number is already sitting in your ad accounts. The dashboard just puts them where they can be compared, and the comparison is where the decisions live.
Read CPA and ROAS together before pausing a campaign. A high CPA alongside a strong ROAS usually means bigger orders, not wasted spend.
Creating an Advertising Dashboard in SimpleKPI
-
Step 1 Decide what each campaign is for
Write down what every live campaign is supposed to do: sell directly, gather leads, or build awareness. The KPI that matters is different for each, and mixing them on one gauge muddies all three. If you're not sure what to track, this list of 28 marketing KPIs is a sensible starting point.
-
Step 2 Add your advertising KPIs
Create each KPI in SimpleKPI with its target and frequency. Tags keep things organized by platform, campaign or client. Plans include unlimited KPIs, so tracking Google, Meta and LinkedIn side by side costs nothing extra.
-
Step 3 Connect your data
Feed numbers in through spreadsheet imports, integrations or the API. Platform metrics tend to arrive daily, while revenue may land weekly from your store or CRM, and the dashboard updates as each lands.
-
Step 4 Build views for different audiences
A detailed campaign view for the specialist running the ads, a spend-versus-return summary for the owner, a clean results page for each client if you're an agency. Same data, different framing.
-
Step 5 Share, review, adjust
Put the dashboard on a screen and bring it to the weekly campaign review. Let scheduled KPI reports carry the numbers to people who won't log in. Kip, the built-in AI, can suggest targets and flag indicative benchmarks (AI estimates, not peer data) as your history builds. Retire any KPI nobody acts on.
List of Advertising KPIs
The table below covers every KPI on the example dashboard. Targets are general guidance. Advertising costs vary so much by industry and platform that your own baseline beats any generic range.
| KPI Name | Typical Target | Description |
|---|---|---|
| Total Spend | Within monthly budget | Everything spent on paid campaigns this period, across all platforms. The denominator under every other number here. |
| Cost Per Click (CPC) | Trending down at steady volume | The average cost paid for each ad click. Watch it by campaign; a cheap click that never converts is still wasted money. |
| Cost Per Acquisition (CPA) | Below your margin per customer | The average cost of winning one customer through ads. If it beats your margin, scale up. If not, stop and fix something. |
| Return on Ad Spend (ROAS) | 3-4x as a working floor | Revenue generated for every dollar spent on advertising. The number the rest of the dashboard exists to explain. |
| Impressions | Set against reach goals | The total number of times ads were displayed. Volume without judgment, but the base every rate below is built on. |
| Click-Through Rate (CTR) | 1-2% on search; lower on display | The percentage of people who click after seeing an ad. The first test of whether the message matches the audience. |
| Average Position | Top 3 on priority campaigns | Where ads typically appear on the page or in search results. Read it beside spend; position bought with money alone rarely holds. |
| Ad Quality Score | 7 or above | The platform's rating of ad relevance and landing page quality. Higher scores earn cheaper clicks, so it quietly moves the whole board. |
| Engagement Rate | 1-5% by platform | Likes, shares and comments relative to reach. A leading signal of ad fatigue when it starts to slide. |
| Traffic from Ads | Steady or rising at flat spend | The number of visitors arriving from paid ads. Compare it with organic traffic to see how much of your audience is rented. |
| Conversion Rate | 2-5% | The percentage of ad clicks that become a purchase, sign-up or inquiry. Where the ad's promise meets the landing page. |
| Lead Generation Rate | Set from your baseline | The rate at which advertising produces qualified leads. The outcome KPI that matters most when the sale closes offline. |
Why Advertising Dashboards Matter
Ad platforms are built to spend. Left alone, they will cheerfully use the whole budget and then report the results in their own most flattering terms. A dashboard you own resets the frame: your KPIs, your targets, every platform judged by the same yardstick on one screen.
The deeper value is speed. Most campaign problems (budget drift, ad fatigue, a landing page that quietly broke) show up in CTR, CPC and conversion rate days before they reach revenue. A marketer watching those numbers daily can pause, rewrite or rebalance while most of the budget is still unspent. One who waits for the month-end report finds out what the money did after it's gone.
And the mix matters less than people think. Whether the budget goes into PPC, social or display, the questions stay the same: is it being seen, is it being clicked, and does the click turn into business? Twelve KPIs on one screen answer all three, and campaigns get judged on what they return rather than on the platform's own report card. That's the point.
Build this dashboard yourself with SimpleKPI's KPI dashboards, and pay one flat price for unlimited users and KPIs.