What is a Creator Dashboard?
A creator dashboard is a visual display that brings a creator's business KPIs, such as affiliate conversion rate, engagement quality and brand partnership renewals, together on one screen. It shows how content performance turns into income, in charts and gauges anyone can read at a glance. Platform analytics tell you how a post did. A creator dashboard tells you how the business is doing, which is a different question.
Overview
Creator work generates numbers everywhere except in one place. Engagement sits inside each platform's analytics, affiliate conversions in a partner portal, deal values in a spreadsheet, collaboration inquiries in an inbox. None of these talk to each other, so the questions that matter most go unanswered. Is deeper engagement producing better deals? Which content sends partners leads that actually buy? Are brands coming back?
A dashboard puts those numbers side by side. Most creator dashboards cover three areas:
- Audience quality covers saves, shares, view duration and comment sentiment. These measure whether people care, not just whether they scrolled past.
- Commercial performance: conversion rates, qualified leads, referral traffic. The value you deliver to brand partners, in numbers they recognize.
- Business health tracks renewal rates, inbound inquiries and deal value growth, the measures that show whether the whole thing compounds.
The example on this page covers all three, which suits a creator running the work as a business rather than a hobby.
Who benefits from this dashboard?
- Influencers: track audience engagement and collaboration inquiries in one place, and walk into brand negotiations holding numbers instead of screenshots.
- Content creators: monitor affiliate conversions and lead generation to see which formats and topics actually pay.
- Brand ambassadors: partnership renewals and deal value growth are the two figures that describe a durable brand relationship, and both live here.
- Managers and agencies: one view per creator beats chasing analytics screenshots across five platforms every month-end.
Dashboard Example Overview
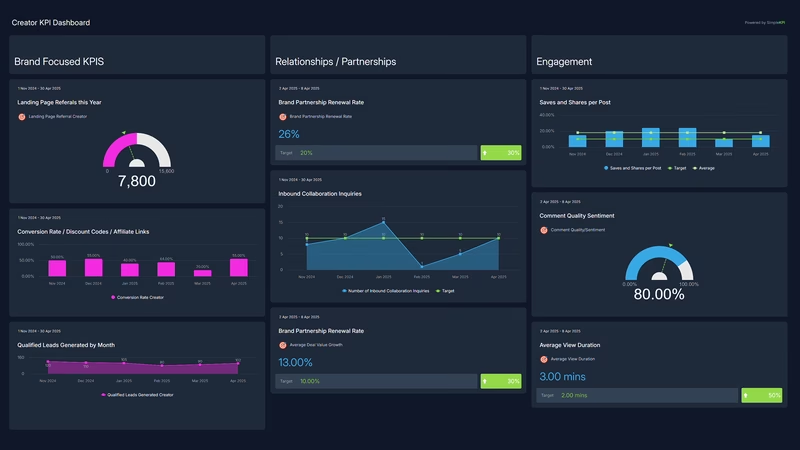
The dashboard pictured here tracks nine KPIs, grouped around three questions:
- Does the content convert? Conversion Rate, Qualified Leads Generated and Landing Page Referral follow what happens after the view: purchases made through affiliate links or discount codes, high-quality leads sent to partners, and visitors directed to a landing page from shared links.
- Is the audience genuinely engaged? Saves and Shares per Post, Average View Duration and Comment Quality/Sentiment measure depth rather than volume. A thousand passive views mean less than a hundred people who saved the post to come back to.
- Is the business growing? Brand Partnership Renewal Rate, Number of Inbound Collaboration Inquiries and Average Deal Value Growth show whether the commercial side compounds: brands rehiring you, new ones approaching, each deal worth more than the last.
Notice what's missing: follower count. That's on purpose. Followers are the easiest number to admire and the hardest to bank. Every KPI on this board is one a brand partner would take seriously, and if you want help choosing the engagement measures, this guide to social media KPIs walks through the options platform by platform.
Renewals follow results. Keep Conversion Rate and Qualified Leads Generated on the same view as Brand Partnership Renewal Rate, because when the first two hold up, renewal conversations mostly take care of themselves.
Creating a Creator Dashboard in SimpleKPI
-
Step 1 Map your creator business
Write down how the work turns into income: content, engagement, leads and conversions, deals, renewals. Pick the measure that matters at each stage. For a longer look at which numbers deserve a place, this piece on KPI dashboards for creator growth is a sensible starting point.
-
Step 2 Add your creator KPIs
Create each KPI in SimpleKPI with a target and a frequency. Tags keep things organized by platform, content format or brand partner. Plans include unlimited KPIs, so tracking all nine of these costs nothing extra.
-
Step 3 Connect your data
Feed numbers in through spreadsheet imports, integrations or the API. Engagement data tends to arrive weekly and deal figures monthly, and the dashboard updates as each lands.
-
Step 4 Build views for different audiences
A content view for daily decisions, a commercial view for deal season, and a clean summary for pitches and renewal calls. Same data, different framing.
-
Step 5 Share, review, adjust
Review the board weekly, and let scheduled KPI reports carry the numbers to a manager, an agency or a brand partner who won't log in. Kip, the built-in AI, can suggest targets and flag indicative benchmarks (AI estimates, not peer data) as your history builds. Retire any KPI that never changes a decision.
List of Creator KPIs
The table below covers every KPI on the example dashboard. Targets are general guidance. Your own baseline beats any generic range.
| KPI Name | Typical Target | Description |
|---|---|---|
| Conversion Rate Creator | 1-5% | Purchases made through your affiliate links or discount codes, as a share of clicks. The most direct proof your content sells. |
| Qualified Leads Generated Creator | Set from your baseline | High-quality leads sent to partners from your content. Decide with each partner what counts as qualified before you measure it. |
| Landing Page Referral Creator | Trending up | Visitors directed to a website or landing page from your shared links. The top of your commercial funnel. |
| Brand Partnership Renewal Rate | Set from your baseline | How often brands rehire you for further collaborations. Repeat deals are cheaper to win than new ones. |
| Number of Inbound Collaboration Inquiries | Trending up | How many brands approach you rather than the other way around. A rising count means your reputation is doing the prospecting. |
| Average Deal Value Growth | Positive year on year | The change in the money value of your brand deals over time. Flat deal values against growing engagement suggest underpricing. |
| Saves and Shares per Post | Rising with reach | How often audiences keep or pass on your content. A better read on usefulness than likes. |
| Average View Duration | Half the length or more | How long viewers stay with your video or audio content. Long durations tell you, and the algorithm, that the content holds. |
| Comment Quality/Sentiment | Mostly positive | The depth and tone of audience comments. Score a sample by hand or with a sentiment tool, then track the trend. |
Why Creator Dashboards Matter
The creator economy rewards consistency, and consistency is hard to judge from inside the work. Platform analytics reset your attention every morning with whatever spiked or dipped overnight. A dashboard holds the longer view: engagement quality this quarter against last, deal values this year against last year, renewals as a running rate. Brands take that view of you already, so it pays to have it first.
The commercial KPIs earn their place in negotiations. A creator who can show conversion rates, qualified leads and referral traffic from past campaigns is selling evidence. One who can only show follower counts is selling hope. The gap between those two conversations is often the gap between rate cards.
And the leading indicators buy time. Renewal rates and deal values are lagging numbers; by the time they sag, the cause is months old. Saves, view duration and comment sentiment move first, so a board that shows both lets you fix the content while the contracts are still healthy. One screen, nine numbers, and the whole business is legible at a glance.
Build this dashboard yourself with SimpleKPI's KPI dashboards, and pay one flat price for unlimited users and KPIs.