What is a Freelance and Gig Economy Dashboard?
A freelance and gig economy dashboard is a visual display that puts an independent worker's key numbers, such as earnings, hourly rate, client retention and proposal conversion, on one screen. It shows how the business behind the work is doing, in charts and gauges rather than a folder of spreadsheets. Freelancers use it to answer the three questions that never go away: am I earning enough, are my clients happy, and where is the next project coming from?
Overview
Freelancing has evolved from a side hustle into a mainstream career path, and it comes with a bookkeeping problem. You are the sales team, the delivery team and the finance department all at once, so the numbers that describe your business end up scattered across invoicing tools, proposal emails and platform apps. A dashboard gathers them in one place. A slow month then shows up as a dip in proposals sent, weeks before it becomes a dip in earnings.
Most freelance dashboards cover three broad areas:
- Money: what you earned, what that works out to per hour, and whether clients pay on time.
- Clients: satisfaction, delivery and retention. These decide whether work comes back.
- Pipeline: proposals out, new clients in, and what each one cost to win.
The example on this page covers all three, plus a fourth that's easy to skip: the hours you invest in your own skills.
Who benefits from this dashboard?
- Freelancers: writers, designers and developers who want to know whether the rates, hours and clients add up to a business worth keeping.
- Gig workers: if you work across delivery, ride-share or task platforms, combining earnings and hours in one view shows what an hour is really worth.
- Consultants: retention and satisfaction tracked per engagement, not as a gut feeling at renewal time.
- Small studios and duos: the same KPIs still work when "you" becomes two or three people, and the dashboard becomes the Monday meeting.
Dashboard Example Overview
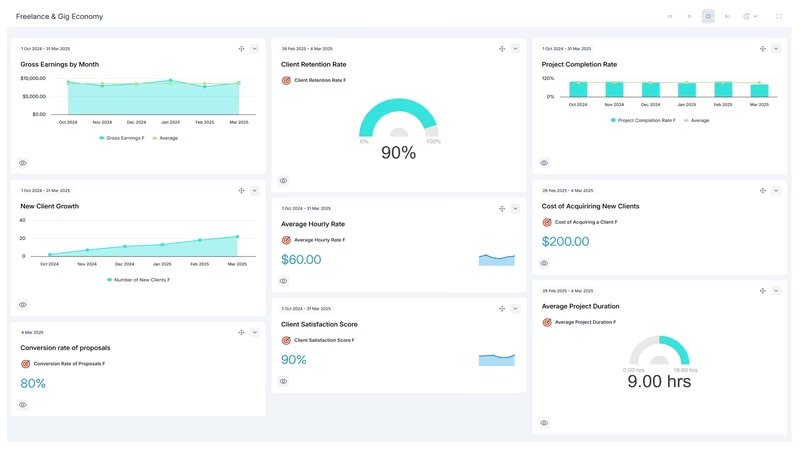
The dashboard pictured here tracks twelve KPIs, grouped around four questions:
- Am I earning properly? Gross Earnings gives the headline, Average Hourly Rate says what the work is really worth, and On-time Payment Rate shows whether the money arrives when it should.
- Are clients happy and coming back? Client Satisfaction Score and Project Completion Rate measure delivery. Client Retention Rate shows whether good delivery turns into repeat work.
- Where is the next project coming from? Number of New Clients, Conversion Rate of Proposals, Cost of Acquiring a Client and Social Media Engagement Rate cover the pipeline that decides what next quarter looks like.
- Am I getting better? Average Project Duration tracks how long work takes, and Skill Development Hours records the investment that keeps next year's rates higher than this year's.
Nothing here needs special software to count. Earnings and payment dates come from your invoices, satisfaction from a one-question survey at project close, proposals from your sent folder. That's deliberate. A dashboard you can feed in ten minutes a week is one you'll still be feeding in a year.
Read Conversion Rate of Proposals next to Cost of Acquiring a Client. When proposals convert well but each new client costs too much, the fix is where you look for work, not how you pitch.
Creating a Freelance and Gig Economy Dashboard in SimpleKPI
-
Step 1 Decide what a good month looks like
Write down the earnings, client and pipeline numbers that would make you happy on the last day of the month. Those become your targets. If most of your client relationships run over email and video calls, this guide to KPIs for remote work covers the measures that keep distant relationships visible.
-
Step 2 Add your freelance KPIs
Create each KPI in SimpleKPI with its target and frequency. Weekly suits pipeline numbers; monthly suits earnings and retention. Plans include unlimited KPIs, so track the skill hours too, even if nobody but you ever looks at them.
-
Step 3 Connect your data
Enter numbers directly, import a spreadsheet, or feed data in through integrations and the API. Most freelancers start with a short Friday entry habit and automate later, if at all.
-
Step 4 Build the views you'll actually use
One view for money and one for pipeline works well. If social channels bring you work, it's worth seeing how creators use KPI dashboards to grow an audience, because the engagement-to-client path is the same one you're on.
-
Step 5 Review on a schedule, not a whim
Pick a review day and let scheduled KPI reports land in your inbox before it. Kip, the built-in AI, can suggest targets and offer indicative benchmarks (AI estimates, not peer data) once you have a few months of history. Retire any KPI you haven't acted on in a quarter.
List of Freelance and Gig Economy KPIs
The table below covers every KPI on the example dashboard. The targets are general guidance. A few months of your own data beats any of them.
| KPI Name | Typical Target | Description |
|---|---|---|
| Gross Earnings | On target or above | Total earnings from completed work in the period. The headline number everything else here helps explain. |
| Average Hourly Rate | Trending up | Earnings divided by hours worked, across everything. The honest version of your quoted rate. |
| On-time Payment Rate | 90% or higher | The percentage of invoices paid on or before the due date. Late payers are a cash flow problem you can see coming. |
| Client Satisfaction Score | 4.5 out of 5 or higher | Average rating from clients on completed projects. One question asked every time beats a long survey sent occasionally. |
| Project Completion Rate | 90% or higher | The percentage of projects finished on or before the deadline. Reputation, expressed as a number. |
| Client Retention Rate | Trending up | The percentage of clients returning for repeat business. Repeat clients cost nothing to win and rarely haggle. |
| Number of New Clients | Steady month to month | New clients won in the period. Feast-and-famine cycles show up here first. |
| Conversion Rate of Proposals | 20-30% | The percentage of proposals accepted out of proposals sent. A low rate on good work usually means the wrong prospects, not the wrong pitch. |
| Cost of Acquiring a Client | Set from your baseline | Marketing and platform spend divided by new clients won. Compare it with what a first project pays. |
| Social Media Engagement Rate | 1-5% | Engagement as a share of audience across your channels. Worth tracking only if those channels bring you work. |
| Average Project Duration | Stable or falling | The average time taken to complete projects. Rising duration at a fixed price quietly cuts your hourly rate. |
| Skill Development Hours | Consistent month to month | Hours spent on learning and professional development. The KPI that defends next year's rates. |
Why Freelance and Gig Economy Dashboards Matter
Freelancing offers freedom, and the price of that freedom is that nobody else watches the numbers. No finance department warns you the pipeline looks thin. No manager points out that your effective hourly rate slipped when that fixed-price project overran. A dashboard does that job in a few minutes a week.
The deeper value is in the connections. Gross Earnings is a lagging number. By the time it disappoints, the cause is weeks old: fewer proposals sent, or an anchor client who quietly moved on. A dashboard that shows proposals, new clients and retention beside earnings lets you act while there's still a month to save.
It changes negotiations, too. Walking into a rate conversation knowing your satisfaction score, on-time delivery record and retention rate is very different from hoping the client remembers you fondly. Twelve numbers on one screen turn a precarious way to work into a business you can steer.
Build this dashboard yourself with SimpleKPI's KPI dashboards, and pay one flat price for unlimited users and KPIs.