What is a Human Resources Dashboard?
A human resources dashboard is a visual display that brings a company's key workforce KPIs, such as absence rate, headcount, hires and recruitment costs, together on one screen. It shows each measure against target in charts and gauges, so staffing questions get answered without a dig through spreadsheets. HR managers use it to run the department day to day. Executives use it to check the workforce is stable and hiring is keeping pace with the plan.
Overview
HR data scatters by nature: absence sits in payroll, hires in the applicant tracking system, agency invoices in accounts. A dashboard puts those numbers side by side, and the relationships start to show. When days to hire stretches, agency fees usually follow. When absence creeps up, the headcount plan quietly stops matching reality.
Most HR dashboards cover some mix of three areas:
- Workforce dashboards track headcount, absence and retention. They describe the shape and stability of the team.
- Recruitment dashboards follow hires, time to hire and what each filled role costs.
- Cost dashboards add up the spend, from HR expenses to agency fees, and set it against the headcount it supports.
The example on this page blends all three into one view, which suits an HR manager who wants a single place to watch the whole function.
Who benefits from this dashboard?
- HR managers: absence, headcount and hiring progress in one place, so problems get spotted while they're still small.
- Recruiters: Number of Hires and Days taken to Hire show whether the pipeline is delivering. Agency Fees shows what it costs when it isn't.
- Finance: Total HR Costs beside average headcount gives a clean cost-per-employee figure without a spreadsheet exercise.
- Executives and owners: employees are the most important asset a business has. One screen showing the team is stable, present and growing is usually all a board pack needs.
Dashboard Example Overview
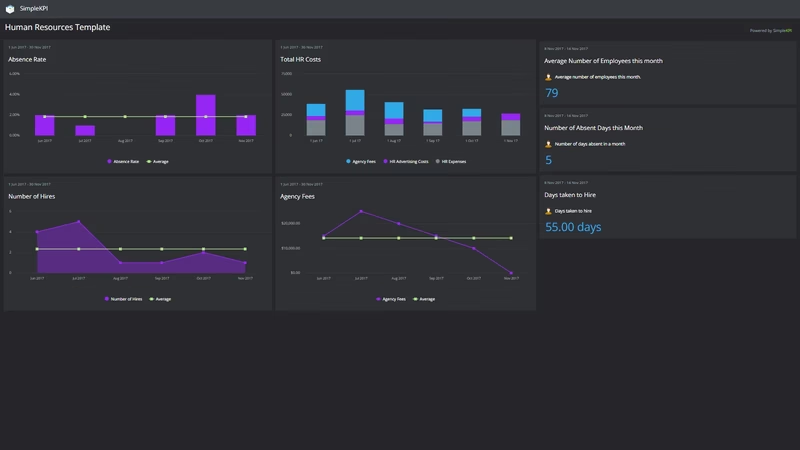
The dashboard pictured here is a dark-themed HR board built in SimpleKPI. It tracks seven KPIs, grouped around four questions:
- How big is the team? Average Number of Employees this month gives the current picture, while Average Number of Employees tracks the longer running average, so a seasonal dip doesn't get mistaken for a trend.
- Are people at work? Absence Rate turns days lost into a percentage of available workdays. It's the clearest single signal of workforce health on the board.
- Is hiring keeping up? Number of Hires and Days taken to Hire show whether recruitment delivers people at the pace the plan assumes.
- What is it all costing? Total HR Costs and Agency Fees keep the spend visible, so recruitment wins are judged against what they cost.
Seven KPIs is a deliberately small set. Every one comes straight from records HR already keeps: payroll, the leave calendar, agency invoices. That makes the dashboard cheap to maintain, and a dashboard that's cheap to maintain gets read.
Watch Days taken to Hire and Agency Fees on the same view. When time to hire stretches, agency spend tends to follow a month or two later, and you'll see it coming.
Creating a Human Resources Dashboard in SimpleKPI
-
Step 1 Map your HR priorities
Write down the questions the business asks you every month: how many people do we have, are they at work, how fast do roles fill, what does it cost. Pick one measure for each. If you want a longer menu to choose from, this guide to employee KPIs covers the field.
-
Step 2 Add your HR KPIs
Create each KPI in SimpleKPI with a target and an entry frequency. Tags keep things organized by department, site or region. Plans include unlimited KPIs, so the list can grow as your reporting does.
-
Step 3 Connect your data
Bring numbers in through spreadsheet imports, integrations or the API. Absence and headcount usually land weekly from payroll, costs at month-end, and the dashboard updates as each feed arrives.
-
Step 4 Build views for different audiences
A recruitment view for the hiring team, a cost summary for finance, a one-page overview for the board. Same data, different emphasis. Nobody sits through numbers that aren't theirs.
-
Step 5 Share, review, adjust
Bring the dashboard to monthly reviews and let scheduled KPI reports deliver the numbers to managers who won't log in. Kip, the built-in AI, can suggest targets and offer indicative benchmarks (AI estimates, not peer data) once some history builds up. Drop any KPI that never changes a decision.
List of Human Resources KPIs
Every KPI on the pictured dashboard is listed below. Treat the targets as general guidance; your own baseline beats any generic range.
| KPI Name | Typical Target | Description |
|---|---|---|
| Absence Rate | Under 3% | The core measure of absenteeism: workdays lost to absence as a share of available workdays. Small moves here are worth investigating early. |
| Total HR Costs | Set from your baseline | The full cost of running the HR function this period, salaries through systems. Track it beside headcount for a cost-per-employee figure. |
| Average Number of Employees this month | In line with headcount plan | The average number of employees this month, smoothing out starters and leavers. The denominator behind most other HR rates. |
| Number of Hires | Set against the hiring plan | The total number of new employees hired this period. Read it next to open roles to see whether recruitment is gaining or losing ground. |
| Agency Fees | Trending down | Fees paid to recruitment agencies this period. Often the largest single slice of cost per hire, and the first place to look when spend climbs. |
| Days taken to Hire | 30-45 days | Total days elapsed to fill positions, from opening a role to an accepted offer. Long gaps here cost output and push work onto the existing team. |
| Average Number of Employees | Stable or growing | The rolling average headcount over the longer period. Compare it with the monthly figure to separate seasonal churn from a real trend. |
Why Human Resources Dashboards Matter
Most HR problems announce themselves quietly. Absence ticks up for a quarter before anyone resigns. Time to hire stretches before a headcount gap appears in the plan. A dashboard makes those early signals visible while there's still time to act, which is worth more than any end-of-year report.
It also changes the conversation with the rest of the business. When HR arrives with numbers, absence against last quarter, hires against plan, the discussion moves from impressions to facts. Sharing that view openly is a practical first step toward building a KPI culture, where decisions lean on data instead of the loudest voice in the room.
The quiet payoff is retention. Keeping good people costs far less than replacing them, and the teams where absence and workload get noticed early are the ones people stay in. Track the seven numbers on this board consistently and recruitment costs tend to fall on their own, because fewer roles need filling in the first place.
Build this dashboard yourself with SimpleKPI's KPI dashboards, start from the HR KPI template, and pay one flat price for unlimited users and KPIs.