What is a Personal Development Dashboard?
A personal development dashboard is a visual display that brings your self-improvement KPIs, such as books read, meditation time, goal achievement and happiness, together on one screen. It shows your habits and your outcomes side by side in charts and gauges, so you can see whether the effort is actually moving you forward. Businesses have tracked performance this way for decades. Nothing says you can't run the same discipline on yourself.
Overview
Personal growth takes consistent effort and honest reflection, and both are easier to claim than to prove. You read for two weeks, meditate for one, start a journal, and three months later you can't say what stuck. The evidence sits scattered across half-finished apps and a memory that flatters you. A dashboard fixes the record. Log the sessions, pages, courses and mood scores in one place and the pattern becomes hard to argue with.
Personal dashboards tend to mix three kinds of measure:
- Input KPIs count the work itself: exercise sessions, meditation minutes, journal entries. These are the numbers you control directly.
- Output KPIs record what the work produced, such as courses completed or new skills acquired.
- Outcome KPIs ask whether any of it mattered. Goal achievement, productivity and happiness sit here.
The example on this page tracks all three, and the mix is the point. Inputs without outcomes is a diary. Outcomes without inputs is a wish list.
Who benefits from this dashboard?
- Professionals: track courses completed and new skills acquired against a development plan, and walk into the annual review with numbers instead of recollections.
- Entrepreneurs and business owners: the business gets a dashboard, so the person running it should have one too. Watching exercise, reflection time and happiness alongside the workload helps keep the founder from becoming the bottleneck.
- Lifelong learners: books read and learning journal entries turn a reading habit into a visible streak worth protecting.
- Anyone focused on well-being: meditation time and a self-reported happiness index make emotional health something you check weekly, not something you notice only when it slips.
Dashboard Example Overview
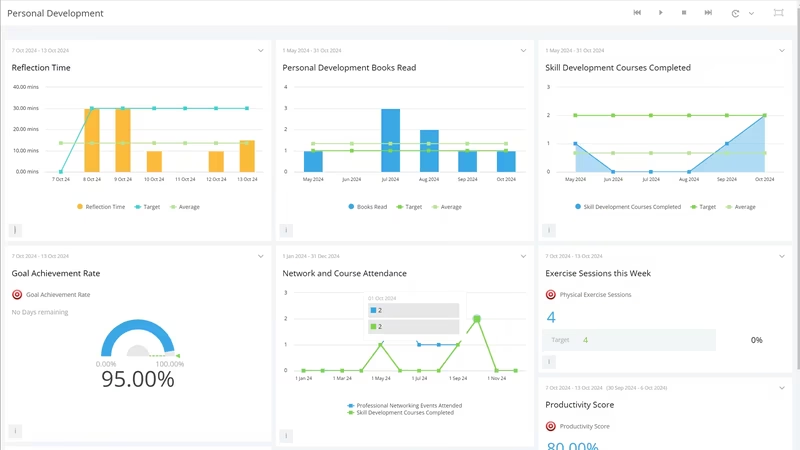
The dashboard pictured here tracks ten KPIs, grouped around four questions:
- Am I putting in the work? Physical Exercise Sessions, Meditation Time and Reflection Time cover the habits. They measure consistency, which is the only thing a habit can be measured by.
- Am I learning? Books Read, Skill Development Courses Completed and Learning Journal Entries track what's going in and what you noted along the way.
- Is it producing anything? New Skills Acquired and Goal Achievement Rate connect the effort to results you can name.
- How am I doing overall? Productivity Score and Happiness Index give the top-line reading. If both drift down while every habit line climbs, the plan itself needs a rethink.
Every number here can be logged in under a minute a day. That matters more than it sounds, because a personal dashboard dies the week logging becomes a chore.
Put Meditation Time, Reflection Time and Happiness Index on the same view. When happiness sags, the two habit lines usually flattened a few weeks earlier. That's your early warning.
Creating a Personal Development Dashboard in SimpleKPI
-
Step 1 Decide what growth means this year
Pick a small number of goals you'd be genuinely pleased to hit in twelve months, then choose the habits that feed each one. Writing goals you can actually measure is a skill in itself; this guide to SMART and SMARTER KPIs covers how.
-
Step 2 Add your personal KPIs
Create each KPI in SimpleKPI with a target and a frequency: daily or weekly for habits, monthly for scores. Plans include unlimited KPIs, so whether you track ten or thirty, the price stays put.
-
Step 3 Log your data
Habit entries take seconds from a phone, and a fixed time of day protects the routine. Score the subjective KPIs, happiness and productivity, on a set schedule such as Sunday evening. Already tracking workouts or reading somewhere else? A spreadsheet import brings the history across.
-
Step 4 Build views for different horizons
One view for the day-to-day habits, another for the quarter's goals. Same data, two timescales. A Happiness Index trend line next to a Meditation Time bar chart tells you more than either chart does alone.
-
Step 5 Review on a schedule
Ten minutes, once a week, same day each time. Scheduled KPI reports can land the week's numbers in your inbox so the review starts itself. Kip, the built-in AI, can suggest targets and flag indicative benchmarks (AI estimates, not peer data) once some history builds up. And retire any KPI you've stopped acting on. A short honest list beats a long neglected one.
List of Personal Development KPIs
The table below covers every KPI on the example dashboard. Targets are general guidance. Your own baseline beats any of them.
| KPI Name | Typical Target | Description |
|---|---|---|
| Books Read | 1-2 per month | Books finished in the period. Finished is the operative word; the half-read pile doesn't count. |
| Skill Development Courses Completed | 1 per quarter | Courses and workshops completed, online or in person. One finished course beats three abandoned ones. |
| Physical Exercise Sessions | 3-5 per week | Workouts, runs, classes or long walks. Count sessions rather than minutes; showing up is the habit. |
| Meditation Time | 10-20 minutes a day | Time spent on mindfulness or breathing practice. Short and daily beats long and occasional. |
| Reflection Time | Weekly, at minimum | Time set aside to review progress and adjust course. The KPI that keeps the other nine honest. |
| Learning Journal Entries | 2-3 per week | Notes on what you learned and what you'd do differently. Writing it down is how it sticks. |
| New Skills Acquired | Set from your baseline | Skills you can genuinely use, not just ones you've studied. Lumpy by nature, so judge it quarterly. |
| Goal Achievement Rate | 70-80% | The share of personal goals completed on time. Hitting 100% every period usually means the goals were too soft. |
| Productivity Score | Trending up | A self-scored rating of how well you used your time. Keep the scoring method fixed so the trend means something. |
| Happiness Index | Stable or rising | Self-reported well-being on a fixed scale. The number is subjective; the trend is not. |
Why Personal Development Dashboards Matter
Self-improvement has a measurement problem. Progress is slow, memory is generous, and nobody is checking in. A dashboard supplies the feedback loop that a job provides automatically. The numbers don't flatter and they don't nag. They sit there being true, which turns out to be enough.
The habit metrics do the heavy lifting. Goal Achievement Rate is a lagging number; by the time a goal is missed, the cause is months old. Exercise sessions, meditation time and journal entries are the leading numbers, and they wobble weeks before the outcomes do. Watch them and you can fix the input while the goal is still within reach. It's the same logic that runs every sales floor, applied to working habits; these four steps to becoming a productivity legend make a good companion read.
The Happiness Index earns its place too. A growth plan that makes you measurably miserable is a bad plan, and without the number you'd rationalize it for another quarter. One screen, ten numbers, and a fair answer to the question that started all this: is the effort working?
Build this dashboard yourself with SimpleKPI's KPI dashboards, and pay one flat price for unlimited users and KPIs.