What is a Fitness Club Dashboard?
A fitness club dashboard is a visual display that brings a club's key membership KPIs, such as membership revenue, new members, retention and attendance, together on one screen. It shows performance against target in charts and gauges, so anyone can see how the club is doing without pulling exports from three systems. Managers use it to run the club week to week. Owners use it to check that the membership base, and the money it produces, is heading the right way.
Overview
Fitness clubs, gyms and exercise studios rely on memberships to sustain the business. Those memberships run month to month or annually, often with classes on top, so the model is a blend of subscription revenue, seasonality and personal commitment. A member who loses the habit becomes a cancellation a few weeks later.
The numbers that describe all this tend to live apart: leads in an ad platform, sign-ups in membership software, expenses in the accounting system. A dashboard puts the whole chain in one view, from advertising spend through conversions to retained members, and the connections become visible. When attendance dips, you can see the cancellations that will follow if nothing changes.
Seasonality makes this more useful, not less. Fitness clubs live with a January surge and an end-of-summer push, and a dashboard that shows each KPI as a trend rather than a single number keeps those swings in context. This month's figure means little until you can see it against last January's.
Who benefits from this dashboard?
- Owners: revenue, expenses and profit in one view, with retention and lifetime value alongside to show whether growth is durable.
- Club managers: immediate access to new members, retention rates and which advertising channels are pulling their weight, without a Friday spent building reports.
- Front desk and sales staff: a visible count of tours, walk-ins and conversions keeps the daily target concrete.
- Marketing: advertising spend next to online and offline conversions shows the real cost of each new member, channel by channel.
Dashboard Example Overview
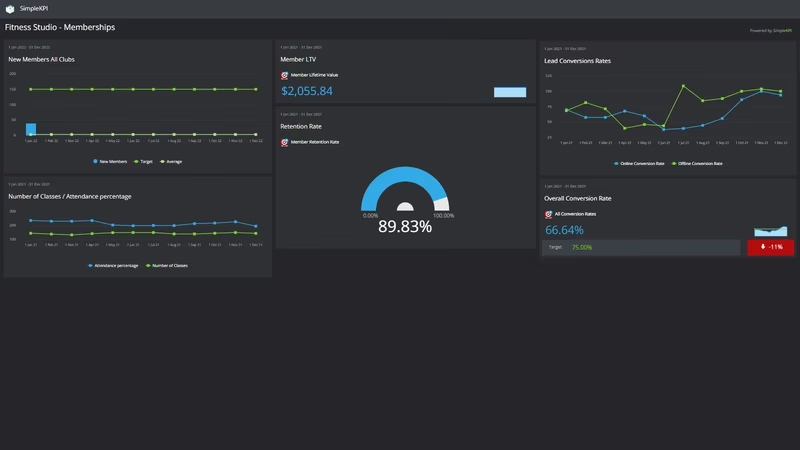
The dashboard pictured here is a dark-themed club board built in SimpleKPI. It tracks fifteen KPIs, grouped around four questions:
- How much money is the club making? Membership Revenue and Additional Revenue cover the income side, Club Total Expenses covers the outgoings, and Profit settles the argument.
- Where do new members come from? Advertising Spend, Online Membership Conversions, Offline Membership Conversions and Walk-in Subscriptions trace each route through the door, with New Members and Member Conversion Rate as the headline results.
- Are members staying, and what are they worth? Member Retention Rate, LTV Member Lifetime Value and CAC Cost to Acquire Customers connect what a member costs with what they return.
- Is the club actually being used? Number of Classes and Attendance percentage show whether the timetable matches how members really behave.
None of these need special tooling to count. Every one comes from records a club already keeps: the membership system, the ad accounts, the class register and the ledger.
Put Advertising Spend, Member Conversion Rate and CAC on the same view. When spend climbs but conversions stay flat, the channel is the problem, not the front desk.
Creating a Fitness Club Dashboard in SimpleKPI
-
Step 1 Map your membership journey
Write down how someone becomes a member and, later, an ex-member: ad or referral, tour or website visit, sign-up, regular attendance, renewal or cancellation. Pick the measure that matters at each stage. If you want prompts, this library of 200 KPI examples is a good place to borrow from.
-
Step 2 Add your fitness club KPIs
Create each KPI in SimpleKPI with its target and frequency. Tags keep things organized by site, team or campaign. Plans include unlimited KPIs, so a second location or a new class program never forces a trim.
-
Step 3 Connect your data
Feed numbers in through spreadsheet imports, integrations or the API. Attendance and sign-ups tend to arrive daily, while revenue and expenses land monthly from accounting, and the dashboard updates as each one does.
-
Step 4 Build views for different audiences
An attendance and new-member screen for the front desk, a marketing view of spend and conversions, a finance summary for the owner. Same data, different framing. This guide to graphs and charts on dashboards helps match each KPI to the right chart.
-
Step 5 Share, review, adjust
Bring the dashboard to weekly staff meetings and let scheduled KPI reports carry the numbers to anyone who won't log in. Kip, the built-in AI, can suggest targets and flag indicative benchmarks (AI estimates, not peer data) once some history builds up. Retire any KPI nobody acts on.
List of Fitness Club KPIs
The table below covers every KPI on the example dashboard. Targets are general guidance. Your own baseline beats any generic range.
| KPI Name | Typical Target | Description |
|---|---|---|
| Membership Revenue | On target or above | Total income from membership dues this period. The subscription base the whole club runs on. |
| Additional Revenue | Stable or growing | Income beyond dues: personal training, paid classes, merchandise, the cafe. A useful cushion in quiet months. |
| New Members | Above monthly cancellations | New memberships signed this period. If this number trails the leavers, the club is shrinking however busy it feels. |
| Number of Classes | Matched to demand | Classes run per week or month. Too few caps attendance; too many burns instructor hours on half-empty rooms. |
| Attendance percentage | 70-85% | The share of booked places that get used. Members who stop turning up usually stop paying soon after, which makes this an early warning for retention. |
| LTV Member Lifetime Value | 3x CAC or better | Average revenue a member generates across their whole membership. Sets the ceiling on what acquisition can sensibly cost. |
| Advertising Spend | Within budget | Total spent on advertising across channels. Only meaningful next to the conversions it buys. |
| Online Membership Conversions | Trending up | Sign-ups completed through the website or app. The cheapest route to scale if the funnel works. |
| Offline Membership Conversions | Consistent month to month | Sign-ups from tours, phone inquiries and referrals. Track these separately from online so each channel earns its keep. |
| Member Conversion Rate | Set from your baseline | The share of leads or inquiries that become members. A direct read on the sales process, from first contact to signature. |
| CAC Cost to Acquire Customers | Falling or stable | Advertising and sales cost divided by new members. Read beside LTV to keep growth affordable. |
| Club Total Expenses | Within budget | Everything it costs to run the club: rent, payroll, equipment, utilities. The quiet half of the profit equation. |
| Profit | Positive and growing | What remains after expenses. The final word on whether the model works. |
| Member Retention Rate | 70%+ annually | The share of members who stay over a given period. The most important number on this board; small changes compound. |
| Walk-in Subscriptions | Steady contribution | Memberships sold to people who simply walked in. Near-zero acquisition cost, so protect whatever drives them. |
Why Fitness Club Dashboards Matter
Membership businesses decline quietly. Revenue looks fine while attendance slips, because members keep paying for a while after they stop coming. By the time cancellations show up in the accounts, the cause is months old. A dashboard that puts Attendance percentage and Member Retention Rate next to revenue lets a manager act while the member still has a habit worth saving.
The acquisition side needs the same honesty. A big January intake is only good news if those members are still around in April, and only affordable if CAC stays comfortably below lifetime value. Watching Advertising Spend, conversions and CAC together turns "we should do more marketing" into a decision about which channel, at what cost, for what kind of member.
Owners in this industry rarely have spare hours for analysis; the day is spent on the floor, not in spreadsheets. A dashboard does the assembly work once, then keeps doing it. Fifteen numbers on one screen tell the whole story: money in, money out, who joined, who stayed, and what each of them cost.
Build this dashboard yourself with SimpleKPI's KPI dashboards, and pay one flat price for unlimited users and KPIs.