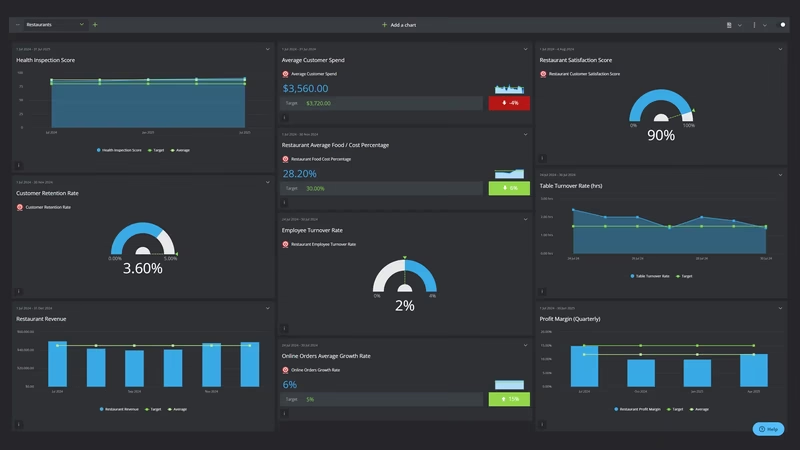
Restaurant Performance Dashboard
It's Monday morning after a full Saturday. Three dining rooms did nearly 1,000 dinner covers between them, the bar was two deep, and the food cost line on the dashboard is green again. The owner still can't work out why there's less in the bank than there was last spring.
Plenty of operators know that feeling. In the National Restaurant Association's 2026 State of the Restaurant Industry report, released in February 2026, 42% of operators said their restaurant was not profitable in 2025, and 60% reported softer customer traffic. More than 9 in 10 named food, labor, insurance, energy and swipe fees as significant challenges.
Menu prices kept climbing, and so did the invoices. USDA's Economic Research Service reports that food-away-from-home prices rose 4.1% in 2024 and 3.8% in 2025, and its September 2026 outlook forecasts 3.5% more in 2026. Beef is the line a full-service kitchen feels most, and ERS expects wholesale beef prices to rise 8.5% this year. Staffing hasn't fully come back either. The NRA's reading of BLS data puts full-service restaurant employment 174,000 jobs, or 3%, below its pre-pandemic level as of August 2026.
The restaurant group behind this board is made up, and its monthly figures are modeled rather than taken from a customer. Its food cost KPI looked healthy for sixteen months and was wrong the entire time, which is the point of the example. If you run a single counter-service shop, the coffee shop dashboard example is a closer fit.
What is a Restaurant KPI Dashboard?
Overview
A restaurant KPI dashboard puts the cost of every plate and every labor hour next to the covers and checks that pay for them, so you can tell a busy month from a profitable one.
Begin at the host stand. Covers count the guests you fed. Dinner table turns show how hard the seats worked on the nights that carry the week.

Then what they spent. Average check per cover is food plus drinks, before tax and tip. Multiply it by covers and you get revenue. Same-store sales growth compares that revenue with the same month a year earlier, for locations open in both, so December is judged against last December rather than against a quiet November.
Then what it cost to serve them. Food cost is the kitchen's number, labor cost is the schedule's, and prime cost adds the two together with the bar's beverage cost. Sales per labor hour turns the schedule into a single figure a manager can act on before the next shift.
Then what guests said on the way out, through the star rating on new online reviews. Restaurant profit margin sits over all of it and tells you what three busy dining rooms actually kept.
Who benefits from this dashboard?
- Owner: Same-store sales growth, prime cost and restaurant profit margin, each against the same month last year, answer the question that matters before a fourth lease: is each location paying for itself?
- General Managers: Sales per labor hour and labor cost show by Tuesday whether last week's schedule matched the covers that walked in.
- Executive Chef and Kitchen Managers: Food cost from weekly counts is their scoreboard. It's also the first place a portion creeping up on the grill station will show.
- Front-of-House Managers: Table turns and the review rating move together. When the floor is short a server, turns slow first and the reviews follow a week or two later.
- Bookkeeper or Outside Accountant: If restaurant profit margin and the cost lines stop agreeing, they're the person who can find out which one is wrong.
Check the denominator on food cost. Divide food purchases by total sales, bar included, and a 33% kitchen reads about 23% when drinks are 29% of the check. Food cost goes over food sales, beverage cost over beverage sales, and only prime cost uses total sales.
Dashboard Example Overview
The example group is family-owned: three full-service restaurants in one Midwest metro, 430 seats in total.
They're open for dinner seven nights and lunch five days, with a full bar that brings in about 29% of sales. One executive chef runs all three kitchens, and the group brings in about $12 million a year.
It reports monthly against ten KPIs:
- Covers: Guests served across all three locations, lunch and dinner, from the POS. Comps and staff meals are left out. It has no target: it's the denominator for average check and table turns, and it's read against the same month last year.
- Average Check per Cover: Food and beverage sales divided by covers, before tax and tip. It moves with menu prices, wine sales and the holiday party calendar.
- Dinner Table Turns: Dinner covers divided by seats, divided by dinner services in the month. Counted by seat, so half-full tables don't look like full turns.
- Same-Store Sales Growth: Revenue growth on a like-for-like basis. Net food and beverage sales in the month, after comps and discounts, against the same month a year earlier, counting only locations open in both months. All three qualify, so here it's the group's revenue growth year on year. It's the sales measure the National Restaurant Association tracks every month: in its survey for August 2026, 51% of operators said same-store sales were higher than in August 2025.
- Food Cost: Food cost of goods sold divided by food sales. Since February 2026 that's opening inventory plus all food purchases minus closing inventory. Before then it was something else, as the story below explains.
- Labor Cost: Hourly wages, salaried managers and chefs, payroll taxes and benefits, divided by total sales.
- Prime Cost: Food cost plus beverage cost plus total labor, divided by total sales. The share of every dollar that goes to what's cooked, poured and paid by the hour.
- Sales per Labor Hour: Revenue divided by hourly labor hours worked, front and back of house. Salaried hours aren't counted.
- Review Rating: Average star rating of new Google and Yelp reviews posted in the month, across all three locations.
- Profit Margin: Restaurant-level profit (sales less prime cost, occupancy and other operating costs) divided by sales, from the accountant's monthly P&L. Corporate overhead, interest and depreciation are left out.
For the first sixteen months, the cost lines looked like a well-run group.
From October 2024 through January 2026, food cost never read higher than 28.6% against a 31% target. Prime cost ran from 55.1% to 60.7%, under its 60% line in all but one month.
Profit margin disagreed.
Through calendar 2025 it ranged from 3.6% in February to 9.6% in December, and it never reached its 10% target.
Sales were slowing as well. Same-store sales growth fell from 3.1% in December 2024 to 0.4% in September 2025, and went negative in October 2025 at -0.3%.
With food cost apparently under control, the owner went after labor.
In June 2025, the general managers started building schedules from forecast covers by daypart and dropped an overlapping mid shift on weeknights.
It worked. Sales per labor hour rose from $58.91 in January 2025 to $65.95 in July.
Labor cost in October 2025 was 31.3%, against 32.3% a year earlier. But restaurant profit margin that October was 6.4%, against 6.7% the October before.
A full point of labor had vanished somewhere.
The year-end close found it.
The outside accountant compared 2025 food purchases on the P&L with what the dashboard implied. The dashboard had only ever seen invoices from the broadline distributor, fed in from its ordering portal.
The meat purveyor that supplied the steaks and burger blend, the seafood company, the bakery and the warehouse-club runs on the company card never reached it. Nobody counted the walk-ins either, so there was no inventory change in the sum.
As beef got pricier through 2025, more of the food spend went to the meat purveyor, one of the vendors the KPI couldn't see.
From February 2026, food cost is calculated from weekly counts in all three kitchens, with every food vendor included.
January 2026, the last month on the old basis, read 28.4%. February read 35.0%.
Prime cost jumped from 59.9% to 64.9%. For the first time, both lines agreed with the 2.6% profit margin the accountant reported that month.
Nothing in the kitchens changed between January and February.
The group didn't try to restate the earlier months. It marked the break in the monthly report instead.
The real work started in March 2026.
The chef re-costed every plate at current invoice prices, and the menu was repriced about 4.5%. That took the average check from $40.80 in February to $42.07 in March.
The strip steak went from 12 to 10 ounces and the burger from 8 to 6.
Portion scales went onto every grill station, each shift kept a waste sheet, order pars were reset from the counts, and produce and seafood went out to rebid.
Food cost fell every month: 33.9% in March, 32.5% in May, 31.5% in July and 30.8% in September, the first month under its 31% target. Restaurant profit margin reached 10.3% in May and 10.5% in July.
Guests noticed the burger.
The review rating fell from 4.6 to 4.3 in April and May, with the smaller patty named again and again.
In June the 8-ounce burger came back at a higher price. The rating recovered to 4.4 in June and 4.5 by August, but it hasn't returned to 4.6.

Covers took a hit from the price rise, too.
April 2026 brought 23,233 covers against 24,193 a year earlier, down 4.0%, and May was down 3.9%. By September the gap had narrowed to 1.5%, 23,263 against 23,614.
Same-store sales growth for September 2026 was 5.1%, on revenue of $982,396, the second month running above its 3.5% target.
All of that growth came from the check. None of it came from the door.
Profit margin was 9.6% against 6.0% a year earlier. Prime cost has settled at 58.7%, after reading 64.9% the month it was first measured properly.
Creating a Restaurant Dashboard in SimpleKPI
-
Step 1 Count the walk-in before you trust food cost
Food cost from purchases alone is a guess. Count every kitchen on the same night each week, ideally Sunday after close, value the count at the latest invoice price, and list every vendor that sells you food, including the ones paid by card. If a vendor's bills skip the calculation, so does that vendor's price rise.
Still deciding which numbers to keep? The KPI selection guide covers how to cut a long list down.
-
Step 2 Give every restaurant number a named owner
The POS owns covers, check, turns and same-store sales. The scheduling and payroll system owns hours and labor cost. The chef owns the counts, and the bookkeeper owns profit margin. Food, labor and prime cost improve as they fall, so set them up that way, or a kitchen that hits 30.8% shows red. Covers gets no direction and no target, since it's there to divide by.
-
Step 3 Match the view to the meeting
The manager on duty needs yesterday's covers, sales per labor hour and new reviews before pre-shift. The Monday managers' meeting needs labor cost and counted food cost by location. The owner needs a monthly view of same-store sales growth, prime cost and profit margin against the same month last year, with December and Mother's Day treated as the outliers they are.
-
Step 4 Price the plate before you shrink it
When a protein gets more expensive, there are two levers: price and portion. Guests forgive a dollar more on a steak faster than they forgive a smaller one. Check covers and the review rating for two months after any menu change, before you call the food cost win.
List of Restaurant KPIs
None of these targets has a current national benchmark we could open and verify, so each is a starting point from this example, and covers has none at all. Replace each with your own costed menu and a year of history.
| KPI Name | Typical Target | Description / Calculation |
|---|---|---|
| Covers | None (context) | Guests served across all locations, lunch and dinner. The denominator for average check and table turns. Compare with the same month last year. |
| Average Check per Cover | $41 (starting point) | Food and beverage sales, before tax and tip, divided by covers. |
| Dinner Table Turns | ≥ 1.5 (starting point) | Dinner covers divided by seats, divided by dinner services in the period. |
| Same-Store Sales Growth | ≥ 3.5% (starting point) | Revenue growth like for like: net sales for locations open in both periods, divided by the same locations' net sales in the same month a year earlier, minus one. |
| Food Cost | ≤ 31% (starting point) | Opening food inventory plus all food purchases minus closing food inventory, divided by food sales. Lower is better. |
| Labor Cost | ≤ 31% (starting point) | Wages, salaries, payroll taxes and benefits divided by total sales. Lower is better. |
| Prime Cost | ≤ 60% (starting point) | Food cost plus beverage cost plus total labor, divided by total sales. Lower is better. |
| Sales per Labor Hour | ≥ $65 (starting point) | Revenue divided by hourly labor hours worked, front and back of house. |
| Review Rating | ≥ 4.5 stars (starting point) | Average star rating of new online reviews posted in the period. |
| Profit Margin | ≥ 10% (starting point) | Sales less prime cost, occupancy and other operating costs, divided by sales. Before corporate overhead, interest and depreciation. |
Why Restaurant Dashboards Matter
A restaurant produces more numbers in a night than most businesses do in a week, and almost none of them live in the same place. The POS has the covers, the scheduling app has the hours, the distributor's portal has some of the invoices, and the accountant has the truth about six weeks later. A food cost figure built from one of those sources can be wrong for a very long time without anyone noticing.
The ten numbers here also push against each other. Cut a mid shift and sales per labor hour rises, until tables wait for a server and turns slow on a Friday. Shrink a portion and food cost falls, until the review rating follows it down. Raise prices and the average check climbs, taking same-store sales growth with it, while covers quietly drop. Each of those moves looks like a win on the one line it was aimed at.
That's why prime cost and profit margin sit at the bottom of this board. They're where the trades settle. A labor saving that doesn't show up in margin went somewhere, and in this example it went into beef nobody was counting.
So when margin and the cost lines disagree, believe margin first and go looking. For a restaurant that usually means one thing: a clipboard, a flashlight and the walk-in cooler on Sunday night. If you also run rooms upstairs, the boutique hotel dashboard example picks up where the dining room leaves off.
Building it in SimpleKPI
Build this dashboard yourself with SimpleKPI's KPI dashboards. The mechanics are the same whatever you track:
- KPIs: each one gets a target, an entry frequency and tags, so you can report by team, site, product or whatever you split the numbers by.
- Data: type numbers in, import a spreadsheet, or use an integration or the API. The dashboard updates as each number lands, so daily and monthly KPIs sit side by side.
- Reports: scheduled KPI reports email the numbers to people who never log in.
- AI: Kip, the built-in AI, suggests targets and flags indicative benchmarks (AI estimates, not peer data) once some history builds up.
- Price: $79 a month for unlimited users and KPIs, as one flat price, with a 14-day free trial and no card needed.