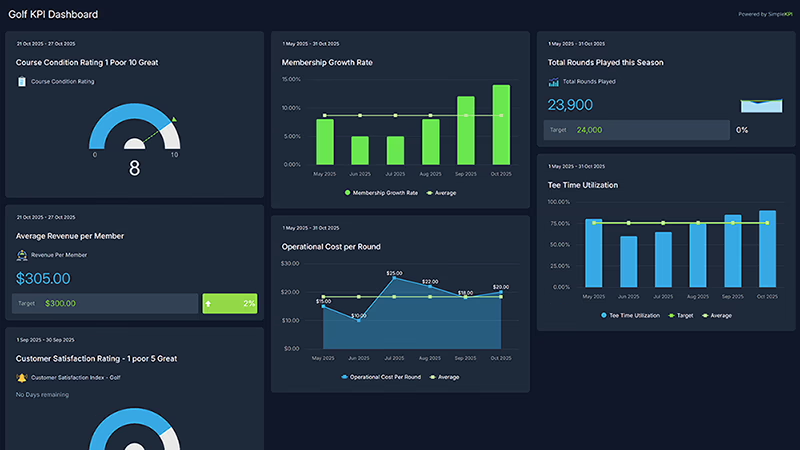
Golf Club Performance Dashboard
It's 7:52 on a Saturday in March. Three groups are waiting on the first tee, the starter is pairing singles into a foursome that's already late, and a member who booked the minute the window opened is asking why he can't get out before ten. The grill will do well today. The member survey next week won't.
Demand isn't the problem in American golf right now. The National Golf Foundation counted a record year for rounds played in 2025, 1.2% ahead of 2024's record, and 29.1 million Americans played on a course in 2025. In NGF's October 2025 look at private play, almost two-thirds of facilities said they were at or near capacity.
Desert golf feels that demand hardest in winter. In February 2025, when US rounds fell just over 11% in the cold, Arizona was up 7%. Summer runs the other way: NGF's July 2026 report had Arizona down 7% for the month. A Phoenix-area club runs two businesses a year, and the winter one pays for the summer one.
This example follows an invented semi-private club near Phoenix: 18 holes, a members' grill, about 450 golf members and public tee times sold online. The club is made up and every monthly figure is modeled. Four targets below lean on a published figure, five are starting points, and one KPI is context with no target.
What is a Golf Club KPI Dashboard?
Overview
A golf club KPI dashboard shows how much of the tee sheet you sold, what each tee time earned, how long the round took, and whether members will still want to play there next year.
It starts with the inventory. Available tee times are the slots the course could have sold on the days it was open. Rounds played and tee sheet utilization show how many were used. Revenue per available tee time, RevPATT, shows what the sheet earned, much as a hotel reads RevPAR.
Then the round itself. Average round time is the number members complain about first. F&B revenue per round shows whether golfers stopped at the turn and stayed for lunch afterward.
Behind the round is the course. Maintenance cost per hole follows the superintendent's spend through overseeding, summer water and labor.
Last come the members. Retention shows who renewed, new members joined shows who replaced them, and the member Net Promoter Score gives a monthly read on how they feel, months before the renewal notice goes out.
Who benefits from this dashboard?
- General Manager: RevPATT and retention sit side by side, and that's the call a GM makes every winter: sell one more public tee time, or protect the member who pays dues all year.
- Head Golf Professional: Utilization and average round time tell the pro shop whether the tee interval is right. A full sheet that plays in 4 hours 50 minutes is oversold.
- Golf Course Superintendent: Maintenance cost per hole puts the overseed bill, summer water and crew hours in one monthly line the green committee can follow.
- Membership Director: When NPS falls in February, that's the warning. Renewals don't arrive until June.
- Board and Golf Committee: Did the policy they voted for in the summer show up on the course? Putting this March next to last March answers it.
On a semi-private club, a member round usually brings in a cart fee and nothing else, so a busy member morning drags RevPATT down while the tee sheet looks full. Before you blame the pro shop for a weak RevPATT, check how many of the month's rounds were member rounds.
Dashboard Example Overview
The club is a semi-private 18-hole desert course with a grill and a halfway house. Members play on dues plus a cart fee; the public books online at rates that rise through the winter. The course closes for about three weeks each October to overseed. Ten KPIs, reported monthly:
- Available Tee Times: The daily start window divided by the tee interval, times the days the course was open. It's the denominator for two other KPIs, so it carries no target. It falls in October with the overseed closure and whenever the interval is widened.
- Golf Rounds Played: 18-hole equivalent rounds from the tee sheet: members, guests and public. The target is set month by month, because March plays three times as many rounds as July.
- Tee Sheet Utilization: Rounds played divided by available tee times multiplied by four players. GGA Partners puts a healthy public or semi-private course at 50 to 65% of weather-adjusted availability.
- Revenue per Available Tee Time (RevPATT): Green and cart fee revenue divided by available tee times, with dues left out. Kimes and Schruben's study of tee time intervals made the case for it as golf's answer to RevPAR.
- Average Round Time: Minutes from tee-off to finishing 18, from the cart GPS. Lower is better.
- F&B Revenue per Round: Grill, halfway house and beverage cart revenue divided by rounds played. Banquets and private events are left out.
- Course Maintenance Cost per Hole: Monthly course maintenance spend, capital excluded, divided by 18. Lower is better, against a budget.
- Golf Member Retention Rate: Rolling 12 months: one minus resignations in the last year divided by members a year earlier. The dues year starts June 1, so most resignations land in June.
- New Golf Members Joined: New golf memberships starting in the month.
- Golf Member Net Promoter Score: Percentage of promoters minus percentage of detractors, from a short survey sent each month to members who played.
The story is in the two winter seasons, compared month for month.
The 2024-25 season runs on 8-minute tee intervals with the membership book wide open. The club signs 47 new golf members between October and March, 13 of them in November. By March 2025 the sheet holds 1,680 available tee times and 5,406 rounds. Utilization reaches 80.4% and RevPATT $303, both fine numbers on their own.
The round says otherwise. Average round time climbs from 253 minutes in October 2024 to 291 in March 2025, or 4 hours 51 minutes. Member NPS falls from +46 to +21 over the same months. The grill does well out of it: F&B revenue per round hits $27.21 in March, because golfers stuck on the 10th tee buy a sandwich.
The bill comes at renewal. Rolling retention slips from 92.0% in May 2025 to 88.3% in June, as members who couldn't get a morning tee time all winter don't renew. Then the summer empties the sheet anyway: in July 2025 utilization is 29.3% and RevPATT $51.
So the club plans the next season in June, not December. It moves the October to April tee sheet to 10-minute intervals, holds weekend mornings before 10 for members, caps golf membership at 450 with a waitlist, and prices public tee times by demand. The October 2025 overseed leaves 520 available tee times, against 612 the year before, and 15 new members come off the waitlist that month.
March 2026 is the comparison that matters. Available tee times fall to 1,395 and rounds to 5,004, down 7.4% on March 2025. But utilization reaches 89.7%, RevPATT is $363, average round time is 262 minutes, and member NPS is +57. Across January to April, rounds fall from 18,893 to 17,276.
F&B is the casualty. Quicker rounds mean fewer stops at the turn, and January 2026 comes in at $23.07 a round against $25.37 a year earlier. The club opens a grab-and-go window by the 10th tee in February, and March recovers to $27.88. The course doesn't get cheaper either: maintenance cost per hole averages $7,373 a month in 2025-26, up from $7,029, with October, the overseed month, at $12,336 a hole.
The year-end numbers settle the argument. Green and cart fee revenue comes to about $2.74 million in both years, on 2,076 fewer rounds, from a sheet that played about half an hour faster at its busiest. The June 2026 renewal holds retention at 92.9%, and it reaches 93.3% by September 2026, when 19 golfers come off the waitlist to fill the cap before the next overseed.
Creating a Golf Club Dashboard in SimpleKPI
-
Step 1 Count available tee times the same way every month
Decide what counts as available before you trust utilization or RevPATT. Do frost delays and monsoon closures come out? Are shotgun events and the overseed weeks excluded? Is a crossover start from the 10th tee one slot or two? Change any of those mid-season and both KPIs move without a single extra golfer.
If you're still settling which measures earn a place on the board, the guide to choosing KPIs goes further.
-
Step 2 Give each number an owner at the club
The tee sheet system holds rounds, available tee times and pace, and the head pro answers for them. The POS holds fee revenue and F&B, split between the pro shop and the clubhouse manager. The superintendent owns maintenance cost, closed off against the monthly accounts. The membership director owns retention, new members and the NPS survey. One source per KPI, and nobody retypes a tee sheet report into a spreadsheet.
-
Step 3 Separate views for the pro shop, the superintendent and the board
The pro shop needs utilization and round time by tee time every week of the season, mornings and afternoons apart. The superintendent needs maintenance cost per hole against budget each month. The board and golf committee need RevPATT, retention and NPS once a month, against the same month last season.
-
Step 4 Plan next season's tee sheet before the renewals land
Compare each peak month with the same month a year earlier, then set the interval, member windows and membership numbers for the next season while there's still time to tell members. This club only acted in June 2025, after the renewals had gone badly. The NPS slide from October to March was the earlier warning.
List of Golf Club KPIs
Tee sheet utilization, maintenance cost per hole, member retention and member NPS have a published figure to compare with, named in the table. The others are this example's starting points, so replace them with targets from your own last two seasons.
| KPI Name | Typical Target | Description / Calculation |
|---|---|---|
| Available Tee Times | No target (context) | Daily start window divided by tee interval, times days open. Denominator for utilization and RevPATT. |
| Golf Rounds Played | 3,000 a month on average, set by month (starting point) | 18-hole equivalent rounds from the tee sheet: members, guests and public. |
| Tee Sheet Utilization | ≥ 60% over the year (GGA Partners healthy range 50 to 65%) | Rounds played divided by (available tee times x 4). |
| Revenue per Available Tee Time (RevPATT) | $175 over the year (starting point) | Green and cart fee revenue divided by available tee times. Dues excluded. |
| Average Round Time | ≤ 255 minutes (starting point) | Average minutes from tee-off to finishing 18. Lower is better. |
| F&B Revenue per Round | $24 (starting point) | Grill, halfway house and beverage cart revenue divided by rounds played. Events excluded. |
| Course Maintenance Cost per Hole | ≤ $7,100 a month (GCSAA 2023 Southwest average, about $7,130) | Monthly course maintenance spend, capital excluded, divided by 18. Lower is better. |
| Golf Member Retention Rate | ≥ 93% (GGA Partners: attrition typically 5 to 8%) | One minus resignations in the last 12 months divided by members 12 months earlier. |
| New Golf Members Joined | 3 a month (starting point) | New golf memberships starting in the month. Under a cap, read it against places available. |
| Golf Member Net Promoter Score | ≥ +60 (GGA Partners average +64 among clubs that track it) | Percentage of promoters (9 to 10) minus percentage of detractors (0 to 6) from a monthly member survey. |
For a head start, our older golf KPI spreadsheet lists eight starter golf club KPIs, including rounds played and tee time utilization, laid out to load straight into SimpleKPI. It predates this page, so its targets differ (80% tee time utilization, for one), and you'll need to add RevPATT, round time, retention and NPS from the table above.
Why Golf Club Dashboards Matter
Every department at a golf club can report a good month while the club has a bad one. The pro shop sold every tee time. The grill had a record March. The superintendent came in under budget. And a few dozen members didn't renew.
Most of these ten numbers pull against at least one other. A tighter tee interval lifts rounds and utilization and stretches the round. A slower round sells more at the halfway house and costs NPS. Public tee times lift RevPATT and take mornings away from members. In Kimes and Schruben's simulation, the number of groups that actually teed off held at about 51 a day at every interval of 12 minutes or less. Squeezing the interval below that only made the queue on the first tee longer.
The course costs more to run each year, whatever the tee sheet does. GCSAA's 2024 survey put the average Southwest 18-hole maintenance budget at $1,539,677 in 2023, against $719,942 for semi-private courses nationally, and Southwest courses that buy water spent $254,110 on it on average. A Golf Course Management article argued that cost per hole is too blunt to compare one course with another. That's fair, so use it to compare your course with itself.
On a desert course, the time to read the board is May. The season has just ended, renewals are a month away, and there's still time to change next winter's tee sheet before the first overseed. Put this March next to last March, decide what the interval should be, and tell the members before they decide whether to renew.
Building it in SimpleKPI
Build this dashboard yourself with SimpleKPI's KPI dashboards. The mechanics are the same whatever you track:
- KPIs: each one gets a target, an entry frequency and tags, so you can report by team, site, product or whatever you split the numbers by.
- Data: type numbers in, import a spreadsheet, or use an integration or the API. The dashboard updates as each number lands, so daily and monthly KPIs sit side by side.
- Reports: scheduled KPI reports email the numbers to people who never log in.
- AI: Kip, the built-in AI, suggests targets and flags indicative benchmarks (AI estimates, not peer data) once some history builds up.
- Price: $79 a month for unlimited users and KPIs, as one flat price, with a 14-day free trial and no card needed.