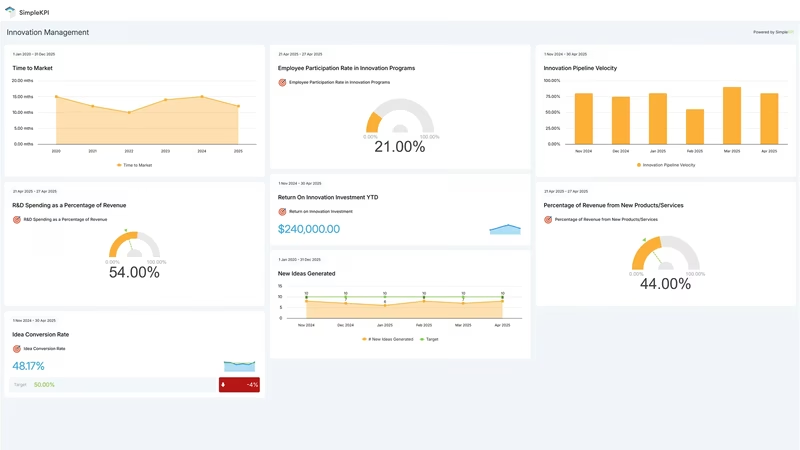
Innovation Performance Dashboard
It's the quarterly portfolio review. The idea portal shows more submissions than ever, a dozen projects passed their gates this month, and the launch calendar for next season is full. Then someone from finance asks how last spring's launches are selling, and nobody has the number to hand.
Product companies are spending more on finding the next product. The National Science Foundation's Business Enterprise R&D survey put US business R&D at $722 billion in 2023, up 4.4% on 2022. For manufacturers, R&D came to 5.5% of domestic sales, and companies with 10 to 249 employees performed 9% of the total.
The tax rules moved the same way. For tax years beginning after December 31, 2021, domestic research spending had to be capitalized and written off over five years. The One, Big, Beautiful Bill Act, signed on July 4, 2025, allows it to be deducted in the year it's spent again, for tax years beginning after December 31, 2024. The IRS set out how to claim it in Revenue Procedure 2025-28. For a profitable company, that lowers the cash tax cost of R&D in the year the money is spent.
More launches is the easy part. In PDMA's 2012 Comparative Performance Assessment Study of 453 business units, 61% of launched products succeeded in the market, so roughly two in five didn't. This example follows an invented US product company that set out to launch more products faster. Its figures are modeled, month by month, to show what a dashboard catches when a push for speed starts costing money.
What is an Innovation Management KPI Dashboard?
Overview
An innovation management KPI dashboard shows whether ideas are turning into products that sell at a profit, and what each step of that journey costs in time and R&D money.
It follows an idea from the portal to the shelf. Ideas submitted is the raw intake. Idea-to-experiment conversion shows how many of them earn a small, funded test with real customers or a working prototype.
Then the gates. Stage-gate pass rate shows how many projects get through each review, and a rate near 100% means the reviews aren't stopping anything. Time to market measures how long a funded project takes to reach the point where it can be sold.
Then the market's verdict. New product success rate is the share of launches that hit the plan written for them. The vitality index is the share of revenue from products launched in the last three years. New product gross margin shows whether that revenue is worth having.
Over all of it sits the money: R&D spend as a share of revenue, and how much of the innovation budget goes beyond the core range into adjacent and transformational work. ISO 56008:2024, the guidance standard on innovation measurement, splits its advice along similar lines, with separate guidance for innovation processes, for individual initiatives and for the portfolio as a whole.
Who benefits from this dashboard?
- CEO or General Manager: Vitality index and new product gross margin answer the board's real question, which is whether the new range is paying its way or just filling the catalog.
- Head of Innovation or VP of Product Development: Gate pass rate, time to market and conversion are their process. When pass rate climbs and success rate falls a few months later, they're the first to know the gates have gone soft.
- CFO: R&D spend as a share of revenue sits next to the revenue it bought. That turns the budget conversation into one about returns, not headcount.
- Category and product managers: They own the six-month success test for each launch. Seeing the rate across the whole range shows whether their own misses are part of a pattern.
- Engineering lead: Non-core share shows whether the platform and new-technology work they were promised is still funded, or quietly eaten by line extensions.
Write down what counts as a new product before the first month. If a new color, a bigger size or a bundled accessory kit counts, the vitality index climbs every time you extend a line, and it will look like growth while the range gets more crowded and less profitable.
Dashboard Example Overview
The invented company makes outdoor grills, smokers and accessories in the US, with about $240 million in annual sales from one plant, sold through home improvement chains, specialty dealers and its own website. A product development team of about 20 people runs the pipeline. It reports monthly on nine KPIs:
- Ideas Submitted: New ideas logged in the idea portal in the month, from staff, dealers and customer reviews. It has no target: it's the denominator for conversion and a check that the front end is alive.
- Idea-to-Experiment Conversion Rate: Ideas given a funded experiment, divided by ideas screened in the month. Experiments are cheap and fast, so a higher rate is fine.
- Stage-Gate Pass Rate: Gate reviews passed, divided by gate reviews held. Set as a ceiling, because gates that pass everything are paperwork.
- New Product Time to Market: Average calendar days from resources first assigned to ready for sale, for products launched in the trailing 12 months. That start and end point follow APQC's definition, whose median across 1,627 organizations is 210 days.
- New Product Success Rate: Products that met their six-month revenue and margin plan, divided by products reaching six months on sale in the trailing 12 months. The plan is fixed at the launch gate.
- New Product Vitality Index: Trailing 12-month revenue from products launched in the last 36 months, divided by total trailing 12-month revenue.
- New Product Gross Margin: Gross margin on products launched in the last 36 months. It catches launch discounts, expedited parts and early returns.
- R&D Spend % of Revenue: Trailing 12-month R&D spend, divided by trailing 12-month revenue. Trailing, because grill sales peak in spring and a monthly ratio would swing with the weather.
- Non-Core Share of Innovation Spend: Project spend tagged adjacent or transformational, divided by all innovation project spend in the month. The 30% target comes from the 70/20/10 split in Nagji and Tuff's 2012 Harvard Business Review article.
In late 2024 the business is steady and a little slow. In October, gates pass 60.0% of reviews, time to market averages 304 days and 66.7% of launches meet their plan. The vitality index is 23.2%, new product gross margin 37.0% and R&D 4.5% of revenue. Non-core work takes 28.1% of project spend.
In January 2025, with a big retailer asking for more new items at its next line review, the CEO sets two goals: twice as many launches for the 2026 grilling season, and time to market under six months. The concept and business case gates are merged into one. Line extensions such as new colors, sizes and accessory kits get a fast-track lane that skips the business case. An idea challenge runs from February to April.
The front of the board turns green quickly. Ideas jump from 44 in January to 96, 118 and 87 during the challenge. Conversion rises from 9.1% to a peak of 21.3% in November 2025. Gate pass rate heads the wrong way for a pipeline, passing 87.5% of reviews in May and 93.8% in August 2025. Time to market falls to 228 days by September 2025 and 208 days by December, under the 210-day target for the first time.
The back of the board takes longer to move, and then it does. New product gross margin drops below its 36% target in October 2025, at 35.0%, and keeps falling to 30.3% in February 2026: tooling rushed into production, air-freighted parts, launch discounts to win shelf space, and returns on a smoker controller that shipped before its firmware was ready. R&D spend reaches its 5.0% ceiling in November 2025 and passes it in December, at 5.2%, as more projects run at once. Non-core share sinks to 13.3% in February 2026, because the fast-track lane fills with extensions and the new pellet-fuel platform waits.
Then the six-month reviews of the rushed launches start arriving. Success rate, at 66.7% for most of 2025, falls to 57.1% in December 2025 and 47.4% by March 2026. Meanwhile the vitality index looks great, at 30.8% in March and a peak of 31.5% in April. More new products means more new product revenue, even when a fair share of it came from customers switching from the company's own older models.
At the March 2026 portfolio review, all nine numbers sit on one screen. Time to market is 185 days and the vitality index is well past target. Against that, pass rate is 86.7% against a 70% ceiling, success rate is 47.4%, gross margin 30.9% and R&D 5.6% of revenue. The leadership team decides the speed was worth having, but not at any price. From April, the business case gate is split back out and expected to stop projects. The CEO's six-month goal for time to market is dropped, and the board's 210-day target stands. Projects in development at once are capped, and adjacent and transformational work gets a ring-fenced 30% of project spend. Small experiments stay cheap and easy to start.
The leading numbers respond within a month or two. Gate pass rate is 66.7% in April 2026 and 64.3% by September. Conversion settles at 14.3%, still above its 12% target, so the front end stays busy. Non-core share climbs back to 21.1% in September, short of 30% but heading the right way. New product gross margin recovers to 33.5%, still below target.
Two numbers haven't turned. Success rate keeps falling, to 40.7% in September 2026, because every six-month review in its window is still a launch from the push. It won't improve until launches approved under the new gates reach their own six-month mark in 2027. R&D spend is 5.6% of revenue in September, above the 5.0% ceiling: monthly spend has come down, but the trailing 12 months still carry the most expensive months of the push. Time to market sits at 185 days, and it's expected to drift up toward 210 as the slower, better-gated projects launch. That's the trade the company chose.
Creating an Innovation Management Dashboard in SimpleKPI
-
Step 1 Write the success test before the launch gate
For every product, record the revenue and margin it should reach six months after launch, and sign it off at the launch gate. If plans can be rewritten after launch, success rate drifts toward 100% and tells you nothing. Product managers own the test; finance owns the actuals.
For more on choosing measures that stand up to that kind of scrutiny, see our guide to picking the right KPIs.
-
Step 2 Split the idea funnel from the portfolio review
Ideas submitted, conversion and gate pass rate belong in a monthly review run by the innovation manager, using the idea portal and the gate log. Vitality index, success rate, R&D spend and non-core share belong in a quarterly portfolio review with finance in the room, because that's where projects are funded or stopped.
-
Step 3 Treat gate pass rate as a ceiling, not a goal
A gate that kills nothing is a calendar entry. Set pass rate up so that a rising number flags red, and read it against new product success rate six to twelve months later. If the two move in opposite directions, the gates got easier.
-
Step 4 Tag every project core, adjacent or transformational at intake
Tag the project when it's created, not at year end, and have the portfolio review agree any change. Without the tag, non-core share can't be measured, and line extensions take over the budget without anyone choosing that. Our engineering project management example covers schedule and cost tracking for the projects themselves.
List of Innovation Management KPIs
Three targets below lean on a published figure: time to market (APQC), success rate (PDMA) and portfolio balance (Harvard Business Review). The rest are (starting point) targets for this example. Replace them once you have a year of your own data.
| KPI Name | Typical Target | Description / Calculation |
|---|---|---|
| Ideas Submitted | No target (context) | New ideas logged in the idea portal in the month. The denominator for conversion. |
| Idea-to-Experiment Conversion Rate | ≥ 12% (starting point) | Ideas given a funded experiment divided by ideas screened in the month. |
| Stage-Gate Pass Rate | ≤ 70% (starting point) | Gate reviews passed divided by gate reviews held. A ceiling: higher means weaker gates. |
| New Product Time to Market | ≤ 210 days (APQC median 210.0) | Average days from resources first assigned to ready for sale, for products launched in the trailing 12 months. Lower is better. |
| New Product Success Rate | ≥ 65% (PDMA 2012: 61% all, 67.5% North America) | Products meeting their six-month revenue and margin plan divided by products reaching six months on sale in the trailing 12 months. |
| New Product Vitality Index | ≥ 25% (starting point) | Trailing 12-month revenue from products launched in the last 36 months divided by total trailing 12-month revenue. |
| New Product Gross Margin | ≥ 36% (starting point) | Revenue less cost of goods on products launched in the last 36 months, divided by their revenue. |
| R&D Spend % of Revenue | ≤ 5.0% (starting point) | Trailing 12-month R&D spend divided by trailing 12-month revenue. A budget ceiling. NSF puts US manufacturers at 5.5% for 2023. |
| Non-Core Share of Innovation Spend | ≥ 30% (HBR 70/20/10) | Project spend tagged adjacent or transformational divided by all innovation project spend. |
Why Innovation Management Dashboards Matter
Innovation runs on two clocks. The front end runs on weeks: an idea arrives, gets a quick test, passes or fails a gate. The market runs on seasons: a product launches, sells through one spring, and only then shows whether it was worth making. Most companies report the fast clock because it's the one they have, and find out about the slow one at year end.
Nearly every pairing on this board pulls in opposite directions. Time to market falls fastest when gates stop saying no, and success rate pays for it six months later. The vitality index rises with every launch, including the ones that only take sales from your older models, so it needs new product gross margin beside it. A fast-track lane for line extensions lifts launch counts and starves the adjacent and transformational work that keeps the range relevant in three years, the same squeeze a manufacturing plant feels when every changeover is for a new variant. And R&D spend can rise for good reasons or bad ones, which only the success rate and margin can tell apart.
None of that means slowing down is the answer. The example company kept most of its speed. What it gave up was the idea that the gates could be skipped for anything that looked like a quick win. The board's job is to show how many ideas it took this year to get one product that sold, and what you spent on the ones that didn't make it.
Before you approve the next fast-track lane, write down the gate pass rate you'd accept and the success rate you expect a year later. Then put both on the same screen.
Building it in SimpleKPI
Build this dashboard yourself with SimpleKPI's KPI dashboards. The mechanics are the same whatever you track:
- KPIs: each one gets a target, an entry frequency and tags, so you can report by team, site, product or whatever you split the numbers by.
- Data: type numbers in, import a spreadsheet, or use an integration or the API. The dashboard updates as each number lands, so daily and monthly KPIs sit side by side.
- Reports: scheduled KPI reports email the numbers to people who never log in.
- AI: Kip, the built-in AI, suggests targets and flags indicative benchmarks (AI estimates, not peer data) once some history builds up.
- Price: $79 a month for unlimited users and KPIs, as one flat price, with a 14-day free trial and no card needed.