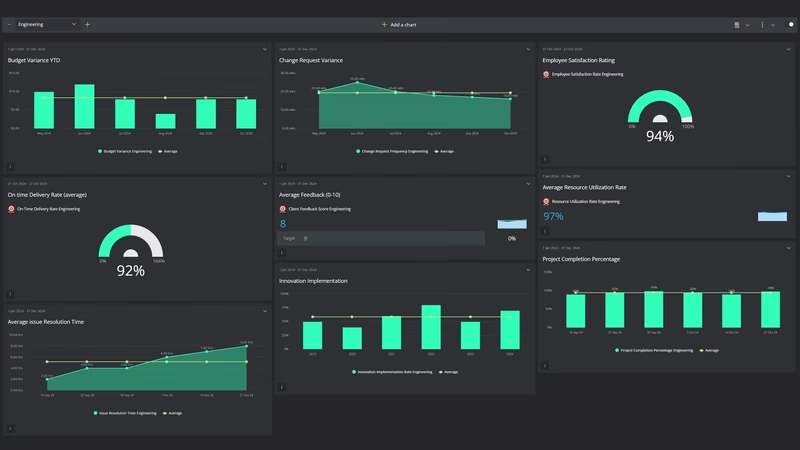
Engineering Project Performance Dashboard
It's the Thursday before a 90% plan set goes to the state DOT. The roadway lead has charged 46 hours to the job this week, the drainage engineer is checking profiles at nine at night, and the set goes out on time. Utilization that month looks excellent. Six weeks later the review comments come back, and a third of them are things the firm would have caught if anyone had had an afternoon to check.
That squeeze is built into the market. The Bureau of Labor Statistics counts 380,600 civil engineers in 2025, 51% of them in engineering services firms, and projects about 22,700 openings a year through 2035. The work is arriving faster than the people. ACEC's Engineering Business Sentiment report for Q3 2026 puts the median firm backlog at 12 months, and says 88% of firms have at least one open position.
So the obvious move is to ask the engineers you already have to bill more hours. Earned value is how you find out whether those hours finished anything. PMI's August 2026 guide to earned value sets out the two ratios this board leans on: schedule performance index, earned value divided by planned value, and cost performance index, earned value divided by actual cost. At 1.0 you're on plan. Below it, you're behind or over.
The firm in this example is made up: a civil and structural consultancy that designs roads, water and sewer lines, stormwater systems and site plans. All 24 months of data are modeled for illustration. It's the engineer of record, not the builder, so for the contractor's side of the same projects see the construction dashboard example, and for building design see the architect dashboard example.
What is an Engineering Project Management KPI Dashboard?
Overview
An engineering project management KPI dashboard shows whether the hours your engineers bill are turning into finished, correct design on the dates you promised clients, and whether there's enough signed work behind them.
It starts before the project does. Proposal win rate tells you how much of what you chase you actually get. Backlog, in months, tells you how long the signed work would keep everyone busy.
Then the people. Billable utilization is the number principals watch most closely, and the one most likely to mislead them.
Then production. Earned value is the fee value of design work actually finished in the month. Divide it by what the schedules said should be finished and you get SPI. Divide it by the time charged and you get CPI. On-time deliverables counts the plan sets, reports and permit packages that left by their contract date.
Then quality and scope. Rework hours are time spent redoing work already checked or issued. Scope creep hours are time spent on things the client asked for that no change order covers.
Last comes the field. Once a project is under construction, contractors send requests for information, and RFI turnaround shows how long they wait for an answer. Two money numbers sit over the lot. Variance at completion (VAC) is PMI's measure of the expected overrun or underrun at the finish: approved fees minus what the active projects are now forecast to cost. Net labor multiplier is fee earned for every dollar of salary charged to projects, the measure that shows whether the design work makes money.
Who benefits from this dashboard?
- Principals: Backlog, win rate and utilization together answer the question that comes up every quarter. Do we hire ahead of the work, or ask the current team to stretch?
- Operations Director: Utilization by discipline shows who is overloaded this month. Rework hours show what that overload costs three months later.
- Project Managers: SPI and CPI on each job show trouble while there's still fee left to fix it, and scope creep hours are the evidence for a change order conversation with the client.
- QA/QC Lead: Rework hours and the RFI log point at the plan sets that went out under-checked, usually weeks before anyone complains.
- Marketing and Proposals Coordinator: When win rate drops, the first thing to check is how many proposal hours the principals actually had that quarter.
Give rework its own timesheet code, and make clear nobody gets blamed for using it. If engineers book rework to the design task it fixes, the hours disappear into the budget, CPI just looks soft, and nobody can tell whether the problem was the estimate or the drawings.
Dashboard Example Overview
The example firm has about 130 staff in three offices across the Carolinas and Virginia, between 114 and 123 of them billable engineers and designers, running around 70 active projects for state DOTs, cities, water utilities, school districts and private developers. It reports twelve KPIs monthly, across the whole portfolio:
- Earned Value: The budgeted fee for design work completed in the month, earned only at agreed milestones. All fee dollars here are at standard billing rates.
- Schedule Performance Index: Earned value divided by planned value, where planned value is the fee for the work the schedules said would be done this month. Under 1.0 means the portfolio is falling behind.
- Cost Performance Index: Earned value divided by actual cost, the time charged to projects valued at the same rates. Under 1.0 means each hour is finishing less than the budget assumed.
- Variance at Completion (VAC): PMI's VAC, budget at completion minus estimate at completion. Here that's the approved fee (including approved change orders) minus forecast cost at completion, as a share of the approved fee, across active projects. Negative means a forecast overrun.
- On-Time Design Deliverables: Deliverables issued on or before their contract date, divided by deliverables due that month. A 60% set that leaves a day late counts as late.
- Billable Utilization: Hours charged to client projects divided by available hours, which are paid hours less holidays and paid time off, for billable staff only.
- Net Labor Multiplier: Net revenue, meaning fees earned less consultant and reimbursable costs, divided by direct labor cost, the salary cost of hours charged to projects. A firm whose billing rates sit at about three times salary earns about 3.0 when the hours finish what the budget assumed. Deltek's Clarity A&E Study counts 3.0 or higher as part of its high-performer bar, and only 12% of participating firms cleared that bar in fiscal 2025.
- Scope Creep Hours: Hours booked to out-of-scope work with no approved change order, as a share of project hours. This is the fee the firm is giving away.
- RFI Turnaround: Average calendar days from receiving a contractor's RFI to issuing the response, on projects in construction administration.
- Rework Hours: Hours booked to the rework code, as a share of project hours. It covers redesign after an internal check or a client review comment that traces back to an error, not client-requested changes.
- Backlog: Contracted fees not yet earned, divided by average monthly earned value over the last three months.
- Proposal Win Rate: Proposals won as a share of proposals decided in the month, by count.
In late 2024 the firm is steady and a little comfortable. In October, utilization is 66.2%, SPI is 1.01, CPI is 1.00, the net labor multiplier is 3.10 and rework is 5.3% of project hours. Contractors get RFI answers in 5.8 days. Backlog is 10.4 months and climbing, as municipal water and roadway work keeps landing.
By February 2025, three engineering roles have been open for months. Rather than wait for hires, the principals raise the utilization target from 66% to 75%. Internal design reviews, training afternoons and some proposal time are cut back so more hours go to client jobs, and project schedules are re-planned on the new hours. In April the firm wins a multi-year DOT on-call contract and backlog jumps to 13.5 months, which makes the call feel right.
For a while it is right. Utilization reaches 72.4% in May and earned value climbs from $1,898,000 in February to $2,187,000, up 15%. SPI is 1.00 and CPI 0.99. The monthly report is mostly green.
The first number to crack is the one furthest from the office. RFI turnaround, 5.5 days in January, reaches 10.5 days in June, because the senior engineers who answer contractors' questions are the same people now fully booked on design. Then the schedule slips. SPI reads 0.99 in June, 0.93 in July and 0.94 in August, three months in a row under 1.0, which PMI's guide treats as a pattern rather than noise. At the time, it gets put down to summer vacations.
By the fall it plainly isn't vacations. Utilization peaks at 75.8% in August. Rework, which trails utilization by about a quarter, climbs from 5.7% of project hours in June to 10.9% in November. Scope creep hours reach 6.4% in October, because clients kept asking for extras and the PMs had no time to write them up. The net labor multiplier, 3.16 in April, is down to 2.75 that month and bottoms at 2.72 in November. That October the firm charges $2,385,000 of time to projects and earns $2,109,000 of value, so $276,000 of hours finished nothing in a single month. By November SPI is 0.88, CPI is 0.87 and only 81% of deliverables leave on time.
What changes the conversation is one chart. The principals put utilization and rework on the same line chart, lining each month's rework up against utilization from three months earlier, and the two lines rise together. Every month spent above about 70% shows up a quarter later as drawings done twice. In December they settle on 71%: not the old 66%, not the 75% that looked so good in May, and with review time protected so the extra point doesn't turn into rework. Senior reviewers get four ring-fenced hours a week to check sets before they're issued. PMs have five business days to send a change notice when a client asks for something new. And the firm hires against the backlog instead of stretching to meet it, with retention raises for the engineers who carried 2025.
From February 2026, utilization holds between 70.8% and 71.6%. Rework falls from 10.4% in January to 5.4% in May and stays near 6% after that. Scope creep is down to 2.8% by March. CPI is back to 1.00 in July and SPI joins it in August, and both hold there in September, and 90% of deliverables go out on time. September's earned value is $2,237,000, against $1,990,000 a year earlier: 12% more at a lower utilization. Some of that is seven more billable staff, up from 116 to 123. More of it is hours no longer spent redrawing. Backlog settles at 11.4 months, just under ACEC's median.
Four numbers lag behind. Proposal win rate, 42% before the push, starts sliding in August 2025 as principals' proposal time runs dry, bottoms at 27% in January 2026 and isn't back above 40% until May. Variance at completion bottoms at -5.9% in January 2026 and is still -3.1% in September, against a -2% target, because the fee burned on 2025's overruns doesn't come back. The net labor multiplier recovers with CPI but stops at 2.97 from July, short of the 3.10 it started at. The new hires and the retention raises cost more per hour than the billing rates written into signed contracts, the DOT on-call among them, so each salary dollar earns a little less than it did. And RFI turnaround, down to 8.7 days in February, climbs back to 10.3 days in June and sits at 10.2 in September. The plan sets rushed out in summer and fall 2025 are now being built, and contractors have questions about them.
Creating an Engineering Project Dashboard in SimpleKPI
-
Step 1 Set earned value milestones for every design phase
Split each phase into milestones the client would recognize: 30% plans, 60% plans, drainage report, 90% plans, issued for construction. Give each one a weight of the phase fee, and earn nothing until it's issued. If PMs estimate percent complete by feel, SPI hovers near 1.0 right up to the week the set is late.
For help deciding which measures earn a place, see the guide to choosing KPIs.
-
Step 2 Agree the utilization denominator and the time codes
Utilization against 2,080 standard hours and utilization against paid hours less holidays and PTO can differ by several points for the same engineer. Pick one. Then add timesheet codes for rework and for out-of-scope work, so scope creep is counted as it happens and not reconstructed at closeout.
-
Step 3 Name an owner for each number
Utilization, rework and scope creep hours come from the timesheet and project accounting system. Earned value milestones belong to each PM, signed off monthly. RFI turnaround comes from the construction administration log, win rate from whoever keeps the proposal tracker, and backlog from accounting. Set the direction as you go: scope creep hours, RFI turnaround and rework hours improve as they fall, and variance at completion improves as it rises toward zero, since PMI counts an overrun as negative. The net labor multiplier comes from project accounting, which holds the salary cost behind each hour.
-
Step 4 Chart utilization next to rework, a quarter later
PMs review SPI, CPI and scope creep on their own projects weekly. The principals' monthly meeting gets one view: utilization beside rework hours, SPI and RFI turnaround, read against the utilization of about three months earlier. That lag is why the cost of a utilization push is invisible in the month it happens.
List of Engineering Project Management KPIs
SPI and CPI have a published reference point, 1.0, net labor multiplier has Deltek's, and backlog has ACEC's survey median. Everything marked starting point is this example's own target, so swap in yours after a year of history.
| KPI Name | Typical Target | Description / Calculation |
|---|---|---|
| Earned Value | $2.1 million a month (starting point) | Budgeted fee for design work completed in the month, earned at agreed milestones. Scale to your firm. |
| Schedule Performance Index | ≥ 1.0 (PMI: 1.0 = on plan) | Earned value divided by planned value. |
| Cost Performance Index | ≥ 1.0 (PMI: 1.0 = on budget) | Earned value divided by actual cost. |
| Variance at Completion (VAC) | ≥ -2% (starting point) | Approved fee minus forecast cost at completion (PMI: VAC = BAC - EAC), divided by approved fee, across active projects. Negative means overrun. |
| On-Time Design Deliverables | ≥ 90% (starting point) | Deliverables issued on or before the contract date divided by deliverables due. |
| Billable Utilization | 71% (starting point) | Hours charged to client projects divided by available hours (paid hours less holidays and PTO). Test any target against rework a quarter later. |
| Net Labor Multiplier | ≥ 3.0 (Deltek Clarity high-performer bar) | Net revenue divided by direct labor cost of hours charged to projects. Higher is better. |
| Scope Creep Hours | ≤ 3% (starting point) | Hours on out-of-scope work with no approved change order divided by project hours. Lower is better. |
| RFI Turnaround | ≤ 7 days (starting point) | Average calendar days from receiving a contractor RFI to issuing the response. Lower is better. |
| Rework Hours | ≤ 6% (starting point) | Hours booked to the rework code divided by project hours. Lower is better. |
| Backlog | About 12 months (ACEC Q3 2026 median 12) | Contracted fees not yet earned divided by average monthly earned value over the last three months. |
| Proposal Win Rate | ≥ 40% (starting point) | Proposals won divided by proposals decided, by count. |
Why Engineering Project Dashboards Matter
In a design firm, the number everyone can see is utilization, because it comes out of the timesheets every week. The numbers it damages arrive later and from somewhere else: rework from the QC check, RFIs from a contractor's trailer, overruns from the project closeout. By the time they show up, nobody connects them to the push that caused them.
Several of these twelve pull in opposite directions. Higher utilization raises earned value for a few months, then drags SPI, CPI and RFI turnaround down as checking time and senior attention run out. CPI can climb back to 1.0 while the net labor multiplier stays short, because salaries moved and the billing rates in signed contracts didn't. A long backlog looks like security, but past what the team can carry it turns into missed dates and pressure to bill more.
None of this shows up one KPI at a time. So the next time someone proposes a higher utilization target, ask to see rework and RFI turnaround from three months after the last time you tried it. If those lines went up, the extra hours were borrowed, and the contractor on site is still waiting for the answer.
Building it in SimpleKPI
Build this dashboard yourself with SimpleKPI's KPI dashboards, or start from the Manufacturing KPIs template. The mechanics are the same whatever you track:
- KPIs: each one gets a target, an entry frequency and tags, so you can report by team, site, product or whatever you split the numbers by.
- Data: type numbers in, import a spreadsheet, or use an integration or the API. The dashboard updates as each number lands, so daily and monthly KPIs sit side by side.
- Reports: scheduled KPI reports email the numbers to people who never log in.
- AI: Kip, the built-in AI, suggests targets and flags indicative benchmarks (AI estimates, not peer data) once some history builds up.
- Price: $79 a month for unlimited users and KPIs, as one flat price, with a 14-day free trial and no card needed.