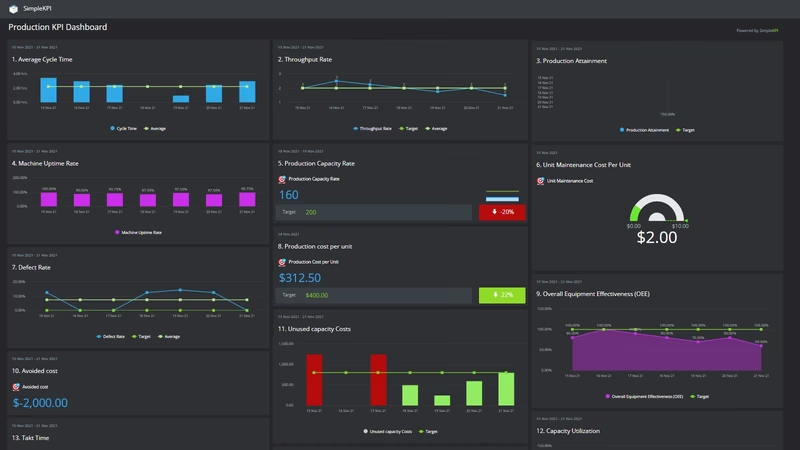
Production Line Performance Dashboard
The purchasing manager calls on a Thursday: the contract is yours, three times your current volume on two part families, first deliveries in eight weeks. Everyone on the floor is pleased for about a day. Then someone asks who's going to run the presses at 2am.
Machines are rarely what runs out first. US factories used 75.7% of their capacity in August 2026, by the Federal Reserve's count, so most have presses or lines idle for part of the week. People and hours are tighter. BLS put the average manufacturing workweek at 40.6 hours in September 2026, with 3.0 hours of overtime, and Saturday overtime only stretches so far before a new contract means a new shift.
The plants that get more out of the same people do it on the floor. In the second quarter of 2026, BLS reported manufacturing output up 5.4% and hours worked up 2.9% at an annual rate, for a 2.4% rise in labor productivity. On a single floor, that kind of gap comes from machines that break down less, change over faster and make fewer bad parts.
This page follows an invented plant through exactly that kind of contract. The company isn't real and its monthly figures are modeled. The part worth reading is what management chose to give up to get the floor back. Three targets in the table below have a published APQC median behind them. The rest are starting points.
What is a Production KPI Dashboard?
Overview
A production KPI dashboard tells a plant manager where the scheduled machine hours went this month, how many of the parts made in them were good, and whether the customer got them on the day promised.
It starts with OEE, overall equipment effectiveness, because it puts every loss on the floor into one percentage. Then it splits that percentage into its three parts. Availability is the share of planned time the machine actually ran. Performance is how fast it ran against its ideal cycle. Quality rate is the share of parts off the machine that were good.
Availability is where most plants lose the most, so its two biggest drains get their own lines. Unplanned downtime covers breakdowns, jams and waiting for maintenance. Average changeover time covers the minutes between the last good part of one job and the first good part of the next.
Then it follows the part off the machine. First-pass yield counts the units that made it through assembly, testing and final inspection without rework or a sort. Customer reject rate, in parts per million, counts what got past all of that.
Last come the two numbers the front office asks about. Schedule attainment shows whether the floor built what the plan said, when it said. Good units per direct labor hour shows what all of it cost in people.
Who benefits from this dashboard?
- Plant Manager: OEE and schedule attainment answer the question a new contract raises first. Can this floor take on more work without the current customers noticing?
- Shift Supervisors: Availability, performance and changeover time, split by shift, show whether nights is losing time to breakdowns, slow cycles or long mold changes. Each of those has a different fix.
- Maintenance Lead: Unplanned downtime is their number. When it climbs after a schedule change, it's usually the planned maintenance that stopped happening, not the machines getting older.
- Quality Manager: The quality rate, first-pass yield and customer rejects in one view show how far a defect traveled before anyone caught it.
- Production Planner: Changeover time and schedule attainment tell them how many short runs the week can absorb before the big orders start shipping late.
Set the ideal cycle time in OEE from the cycle the process was validated at, and don't change it. Plants that use the quoted cycle, or quietly lower the standard after a mold starts running slow, end up with a performance rate that sits near 100% while the press makes fewer parts every week.
Dashboard Example Overview
The example company is a contract injection molder in Ohio with 14 presses and about 110 people, molding housings, trim and clips for appliance and building-products customers. In April 2025 it wins a contract for two families of appliance housings, adds a night shift in June, and reports these ten KPIs monthly:
- OEE: Availability multiplied by performance multiplied by quality rate, from monthly totals. One number for how much of the planned time turned into good parts at full speed.
- Availability: Run time divided by planned production time. Breakdowns and changeovers count against it. The weekly planned maintenance window doesn't, because it's taken out of planned time first.
- Performance Rate: Ideal cycle time multiplied by total parts made, divided by run time. It catches slow cycles and short stops that never get logged as downtime.
- Quality Rate: Good parts divided by total parts made at the press. Scrap and parts set aside for rework both count as bad.
- Unplanned Downtime: Hours lost to breakdowns, jams and waiting for maintenance, as a share of scheduled run time. Changeovers and planned maintenance are left out, matching APQC's definition, so it can be compared with their median.
- Average Changeover Time: Minutes from the last good part of one job to the first good part of the next, averaged across every mold and color change in the month.
- First-Pass Yield: Units that passed assembly, testing and final inspection without rework or sorting, divided by units started.
- Schedule Attainment: Scheduled jobs completed in full in the week they were planned, as a share of jobs scheduled. A job finished early or split across weeks counts as a miss.
- Good Units per Direct Labor Hour: Good parts shipped divided by direct labor hours on the floor, inspectors and material handlers included.
- Customer Reject Rate: Parts rejected by customers per million shipped. It moves a few weeks behind first-pass yield, and it's the one the new customer reads.
Before the contract, the floor runs two shifts and the numbers barely move. OEE sits between 70.3% and 71.7% from October 2024 to May 2025, built from availability around 87%, performance around 84% and a quality rate near 97%. Unplanned downtime is 5.4% in October 2024, changeovers average 48 minutes, first-pass yield is 95.0% and customers reject 190 parts per million.
The night shift starts in June 2025 with eleven new hires, two experienced operators moved over from days and no dedicated setup technician. The new housing molds go into production in the same weeks. By August, unplanned downtime has climbed to 8.0% and the average changeover has stretched to 60 minutes, as night crews hang molds they've seen once.
Quality is the KPI that breaks. Short shots and flash on the new housings get past the press, because nights is running hard to make the rate. First-pass yield drops from 95.0% in May 2025 to 88.4% in October. Customer rejects go from 201 parts per million to 786 in the same five months, more than three times the 250 the new customer's quality agreement allows.
October 2025 is the worst month on the board. OEE falls to 61.8%, from availability of 84.1%, performance of 78.7% and a quality rate of 93.3%. Schedule attainment is 80.0%, so one job in five misses its week, and the plant's older customers start to notice. Good units per labor hour are down to 24.8 from 31.1 a year earlier.
In November the owners accept that the floor can't run everything at once, and decide what to give up. About 40 low-volume part numbers move to fixed monthly campaign runs with longer lead times, and the plant stops quoting new jobs below a minimum run size. Every press loses four hours a week of running time to a planned maintenance window. Two senior setup technicians move to nights. And the new housings get a 100% visual check at the press, which puts an extra person on each of those cells.
Changeovers respond first. There are roughly half as many of them, and the two setup technicians now cover nights, so the average falls from 62 minutes in November 2025 to 47 in February 2026 and 38 by July. Downtime is slower: it's still 7.5% in January 2026, after the holiday shutdown and cold restarts, with schedule attainment at 85.0%. But by April customer rejects are back to 192 parts per million and first-pass yield to 95.4%.
In May 2026 OEE reaches 75.0%, level with APQC's cross-industry median, and unplanned downtime drops to 4.9%, just under APQC's 5.0%. By September 2026 OEE is 77.2%, from 92.6% availability, 85.2% performance and a 97.9% quality rate. Availability is five points higher than before the contract, mostly because the presses spend far less time on changeovers. Schedule attainment is 95.5% and customer rejects are 154 parts per million.
Labor productivity didn't come back. Good units per direct labor hour recover from 24.8 to 29.0 in September 2026, still short of the 31.1 the plant ran before the contract. The extra inspector on each housing cell is most of the gap, and management chose it. Unplanned downtime also slipped back above the median in July and August 2026, at 5.1% and 5.2%, after the summer shutdown week, before falling to 4.7% in September.
Creating a Production Dashboard in SimpleKPI
-
Step 1 Fix planned production time and the ideal cycle
Every OEE argument comes back to two inputs. Decide what comes out of planned time before availability is measured (breaks, planned maintenance, no-order time) and what stays in (changeovers, breakdowns, waiting for material). Then put the ideal cycle for each part on the press setup sheet, so every shift and the OEE calculation use the same figure. Change either input mid-year and the trend line means nothing.
For a wider list to choose from, see 21 production KPIs with formulas, or the guide to choosing KPIs.
-
Step 2 Name where each number is counted
Downtime and cycle counts usually come from the machine monitoring system or the press controllers. Good and bad parts at the press come from the operator's scrap log. First-pass yield comes from final inspection, customer rejects from the quality manager's returns log, and labor hours from payroll. Write the owner next to each KPI, and set unplanned downtime, changeover time and customer rejects to lower is better when you create them.
-
Step 3 Split every floor number by shift
A plant-wide OEE of 70% can be a day shift at 76% and nights at 62%, and the plant average hides it. Record availability, performance, changeover time and first-pass yield by shift from the first day, so the shift handover meeting looks at its own numbers, and the weekly production meeting compares them side by side.
-
Step 4 Read OEE through its three parts, never alone
The same OEE can come from a fast line that keeps breaking down or a reliable one making scrap. Put availability, performance and quality rate directly under OEE on the board, with unplanned downtime and changeover time under availability, so the monthly review starts from the loss, not the headline.
List of Production KPIs
OEE, unplanned downtime and schedule attainment have an APQC cross-industry median to compare against, and the table names each one. The others are this example's starting points, to be replaced with your own once a year of data is in.
| KPI Name | Typical Target | Description / Calculation |
|---|---|---|
| OEE | ≥ 75% (APQC median 75.0%) | Availability multiplied by performance multiplied by quality rate, from monthly totals. |
| Availability | ≥ 90% (starting point) | Run time divided by planned production time. Breakdowns and changeovers count against it. |
| Performance Rate | ≥ 85% (starting point) | Ideal cycle time multiplied by total parts made, divided by run time. |
| Quality Rate | ≥ 97% (starting point) | Good parts divided by total parts made at the machine. |
| Unplanned Downtime | ≤ 5% (APQC median 5.0%) | Unplanned machine downtime hours divided by scheduled run time. Changeovers and planned maintenance excluded. Lower is better. |
| Average Changeover Time | ≤ 40 minutes (starting point) | Total minutes from last good part to first good part across all changeovers, divided by the number of changeovers. Lower is better. |
| First-Pass Yield | ≥ 95% (starting point) | Units passing every step and final inspection without rework or sorting, divided by units started. |
| Schedule Attainment | ≥ 92% (APQC median 90.0%) | Scheduled jobs completed in full in their planned week, divided by jobs scheduled. |
| Good Units per Direct Labor Hour | ≥ 30 (starting point) | Good units shipped divided by direct labor hours on the floor, inspectors included. |
| Customer Reject Rate | ≤ 250 PPM (starting point) | Parts rejected by customers divided by parts shipped, multiplied by one million. Lower is better. |
More Production KPIs to Choose From
Ten KPIs suit one molding plant. Your line may need different ones: a food plant will care about allergen changeovers, a machine shop about spindle hours. The free KPI generator builds a production KPI set for your process, with names, formulas and descriptions you can export to Excel or open in SimpleKPI.
Prefer a spreadsheet? Download 21 production KPIs in Excel, an editable list you can import into SimpleKPI or use on its own.
Why Production Dashboards Matter
On a production floor the losses hide in different logs. Breakdowns are in the maintenance system, scrap is on a clipboard by the press, rework is in the quality database and the late jobs are in the planner's spreadsheet. Each department can show its own month was reasonable while OEE falls ten points.
Several of these ten pull against each other, and the trade only shows when they're on the same screen. Push performance on a night shift that's behind and the quality rate drops with it, because the cycle is the first thing an operator shortens. Cut changeovers by running longer jobs and availability climbs, but small customers wait longer and schedule attainment on their orders can slip. Add inspection to protect the customer and first-pass yield recovers while good units per labor hour stay down, which is exactly the bargain the example plant made.
That's the point of reading them together. The decision in the example wasn't whether to fix quality. It was which of the other numbers to spend doing it: lead time on 40 small part numbers, four press hours a week, and about two units per labor hour.
If you're about to add a shift, put unplanned downtime, changeover minutes and first-pass yield on the board by shift before the first night crew clocks in. In the example, all three had turned by July 2025, three months before customer rejects peaked in October.
Building it in SimpleKPI
Build this dashboard yourself with SimpleKPI's KPI dashboards, or start from the Manufacturing KPIs template. The mechanics are the same whatever you track:
- KPIs: each one gets a target, an entry frequency and tags, so you can report by team, site, product or whatever you split the numbers by.
- Data: type numbers in, import a spreadsheet, or use an integration or the API. The dashboard updates as each number lands, so daily and monthly KPIs sit side by side.
- Reports: scheduled KPI reports email the numbers to people who never log in.
- AI: Kip, the built-in AI, suggests targets and flags indicative benchmarks (AI estimates, not peer data) once some history builds up.
- Price: $79 a month for unlimited users and KPIs, as one flat price, with a 14-day free trial and no card needed.